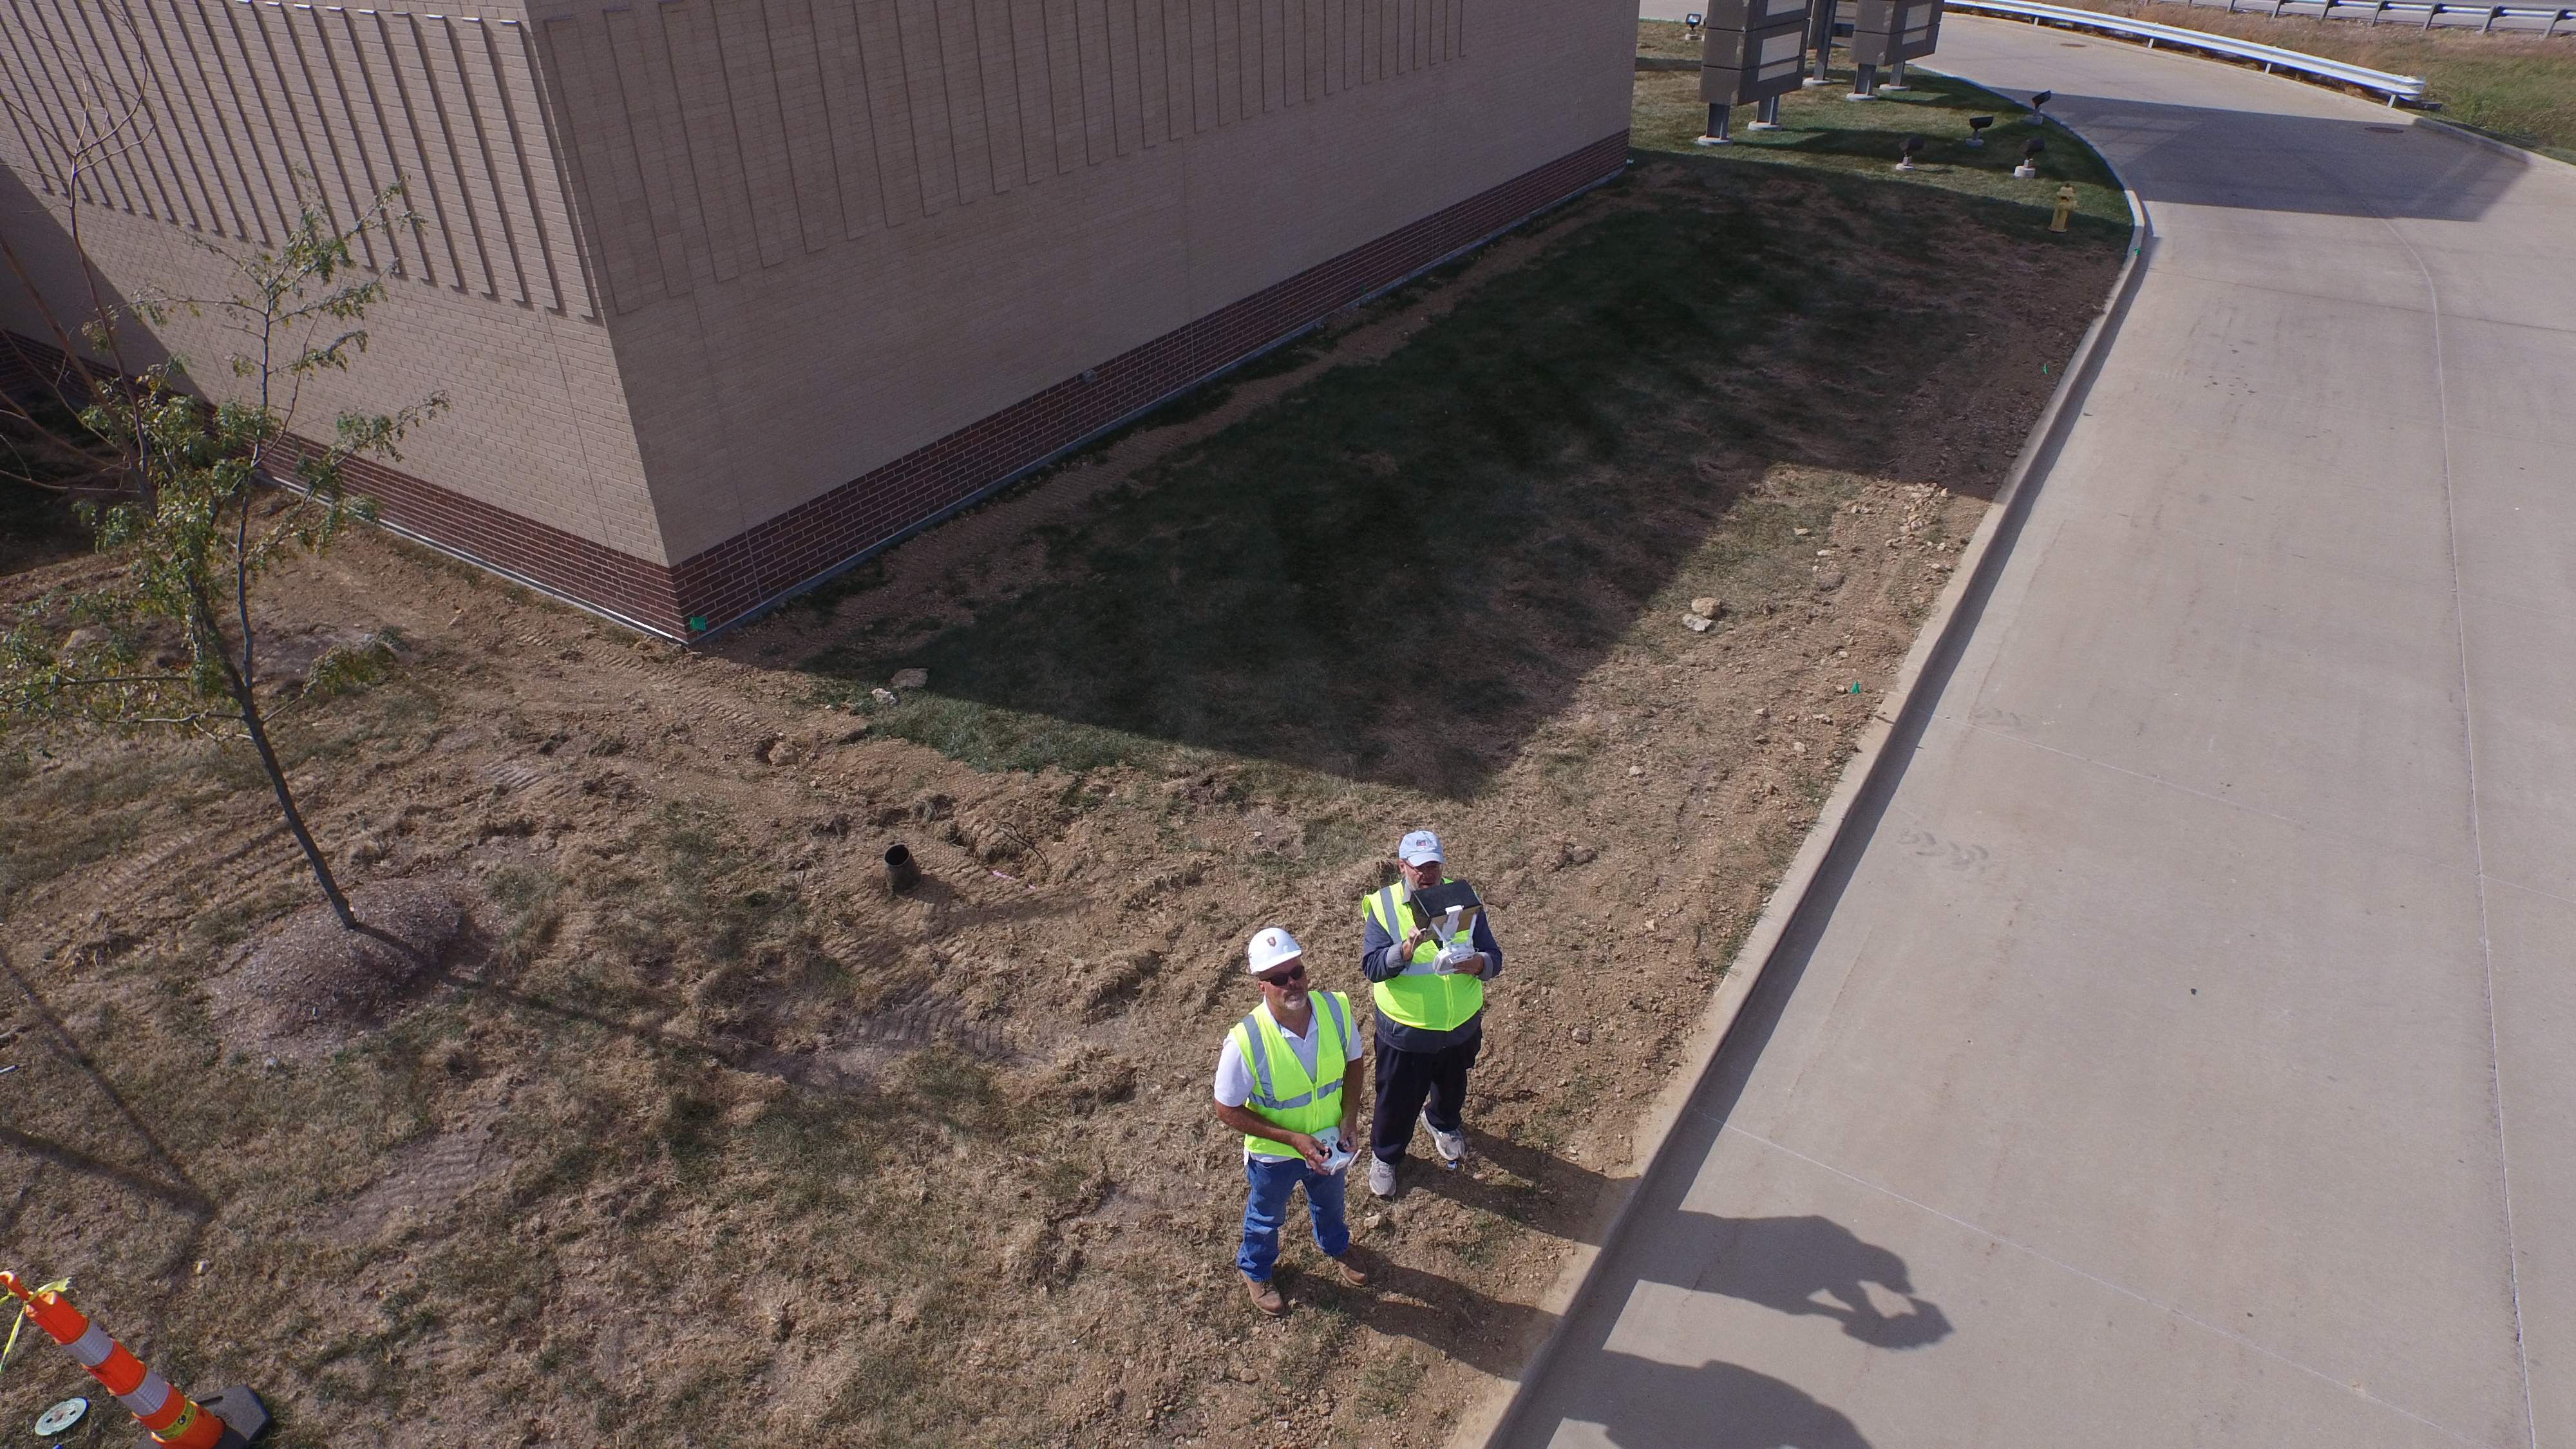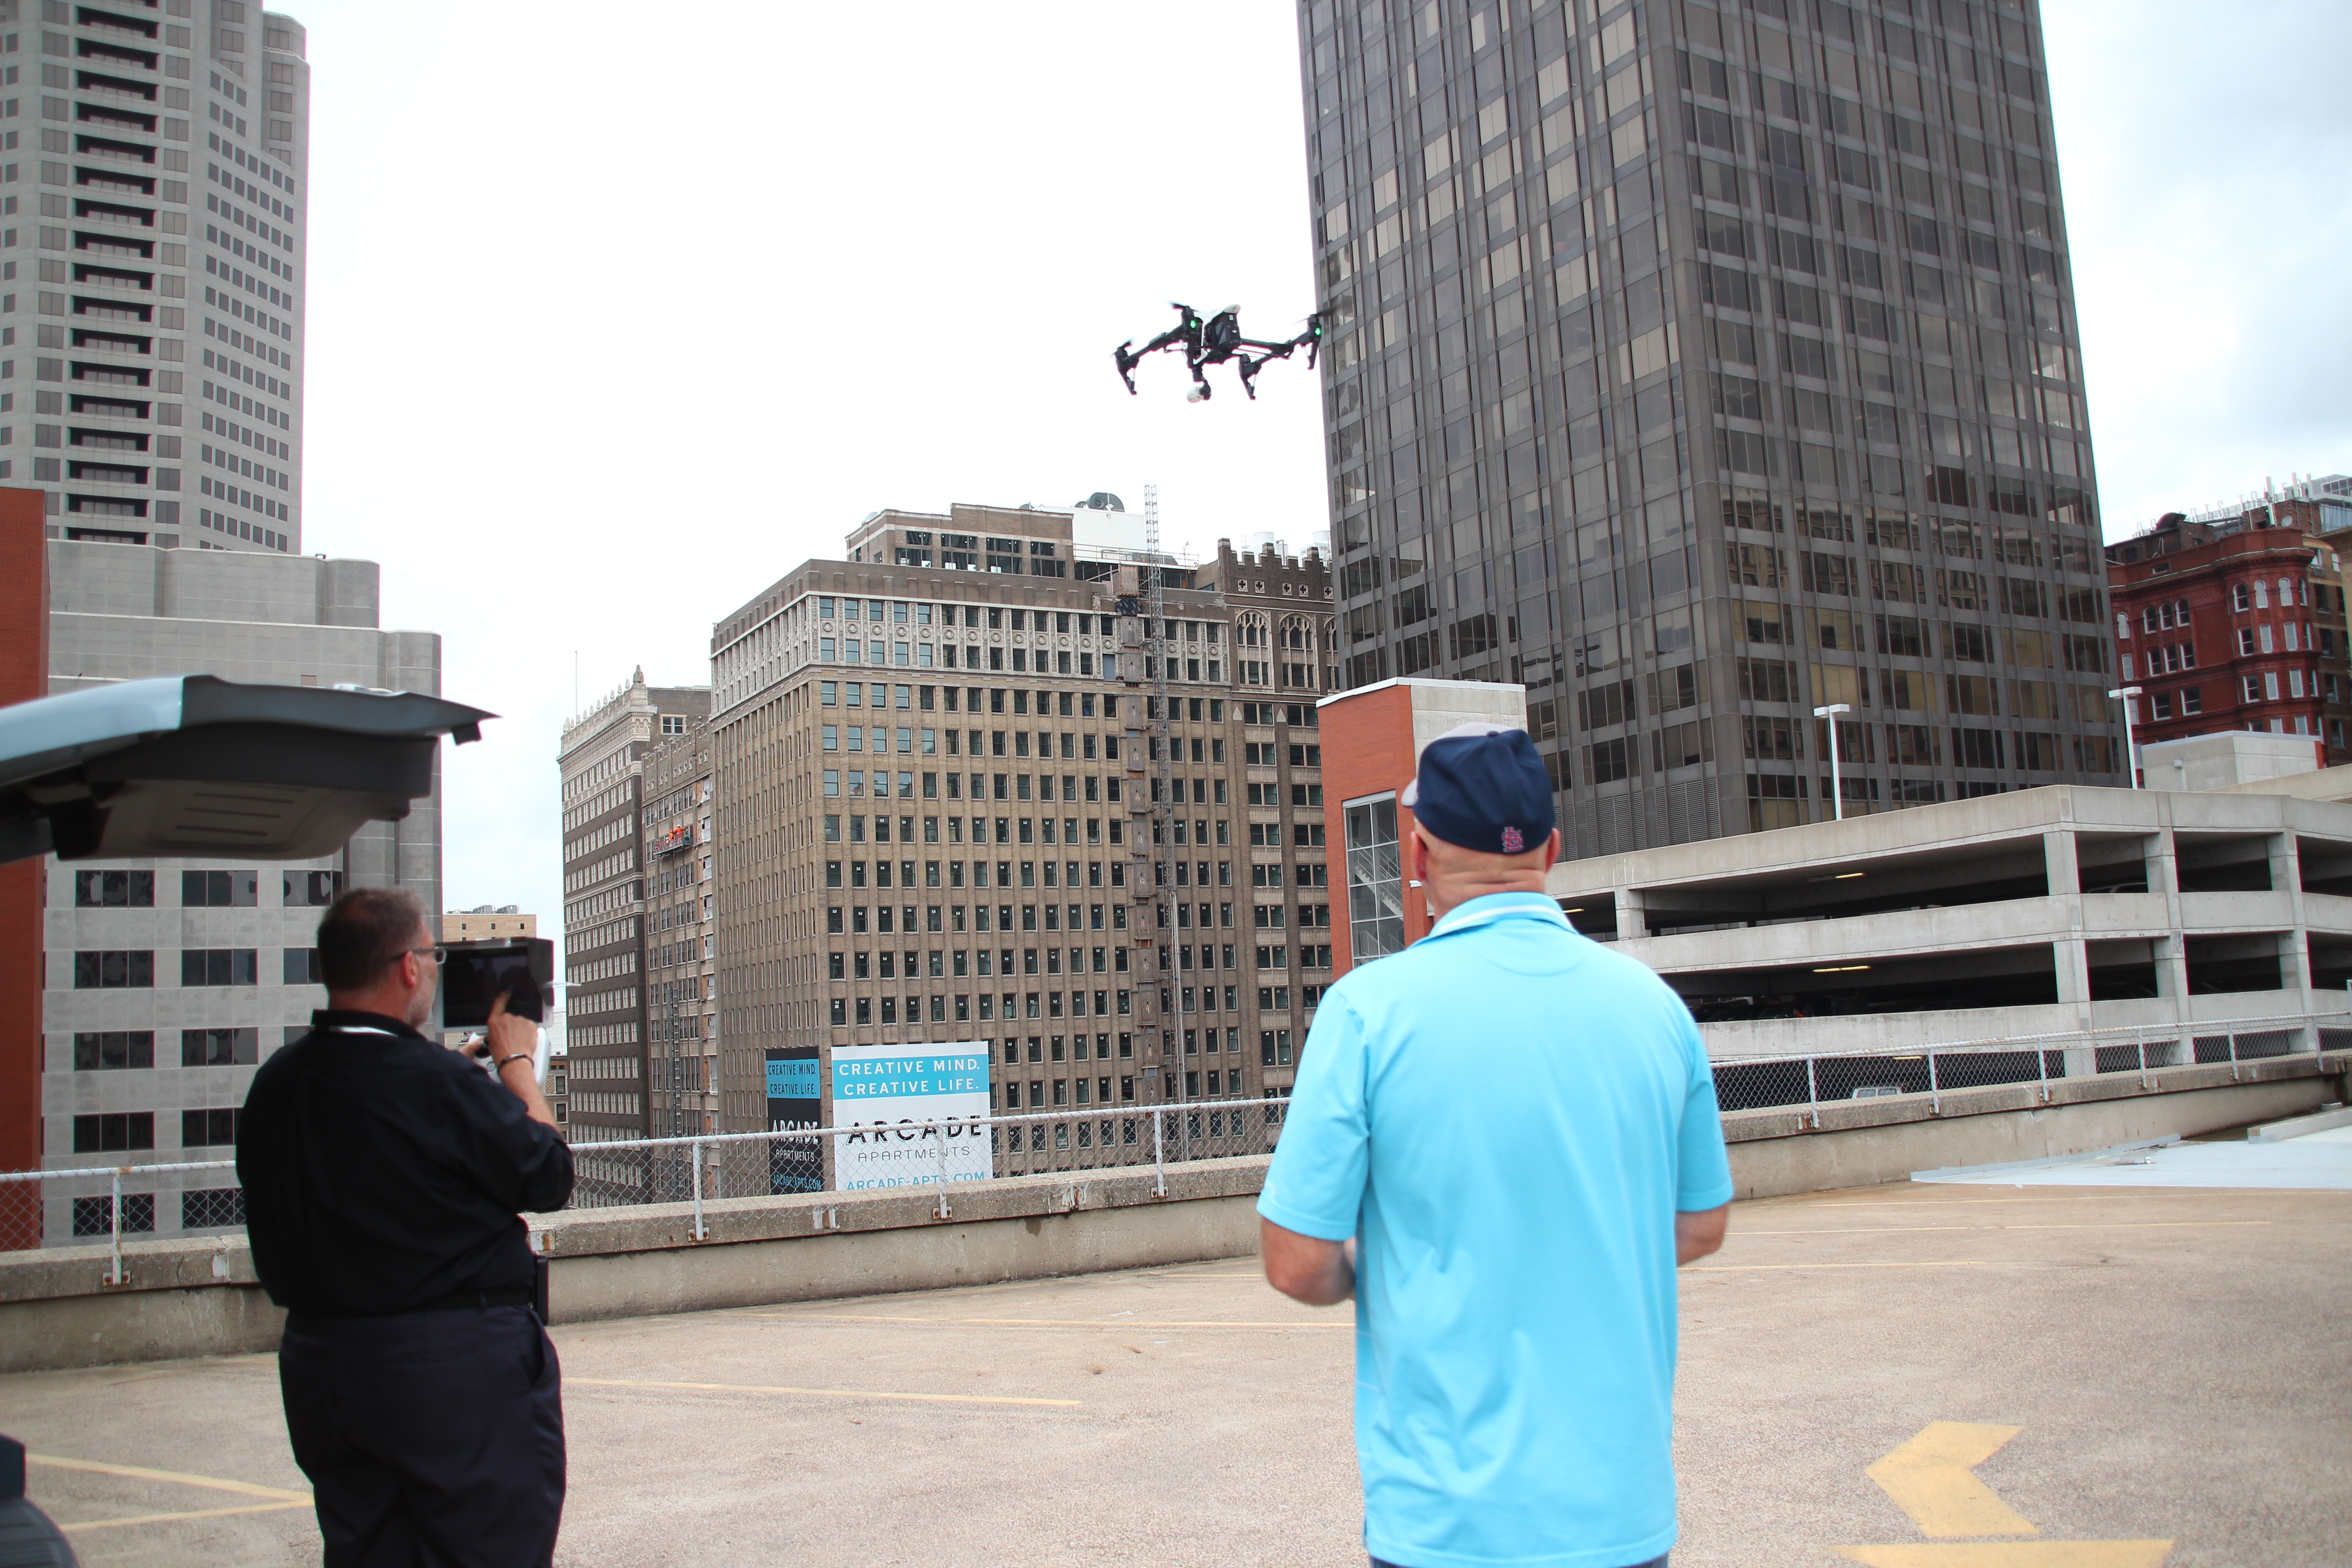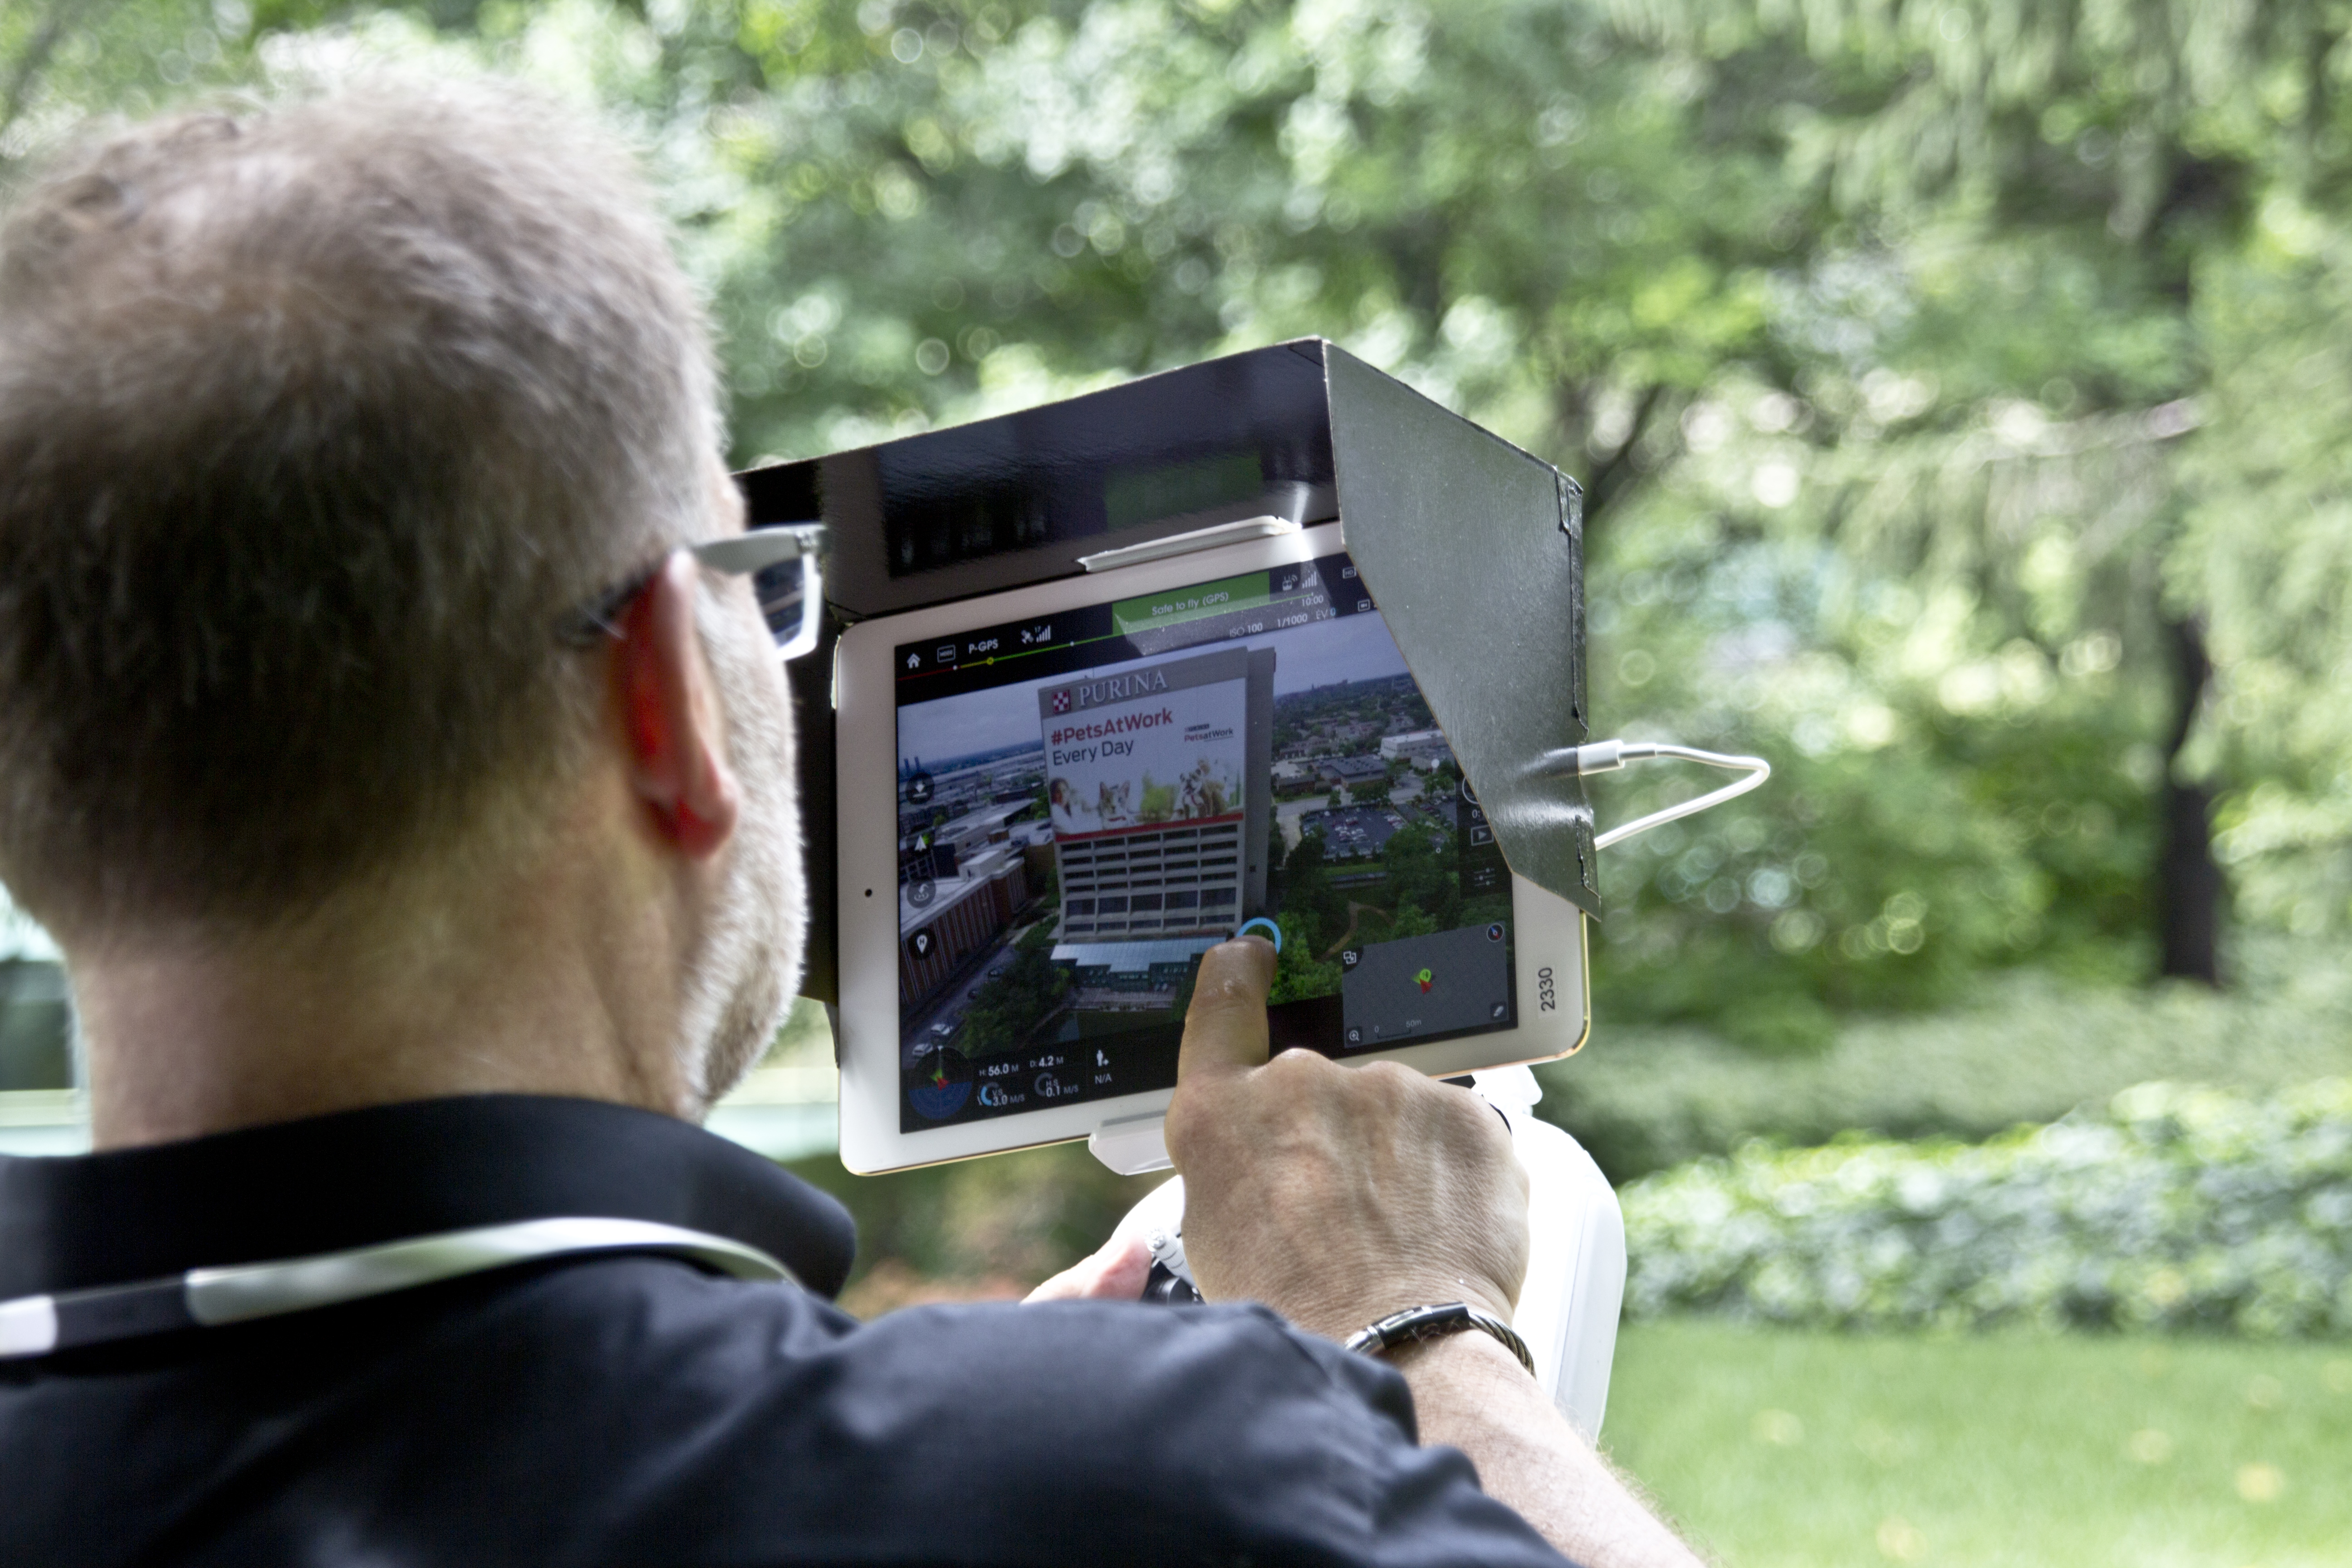
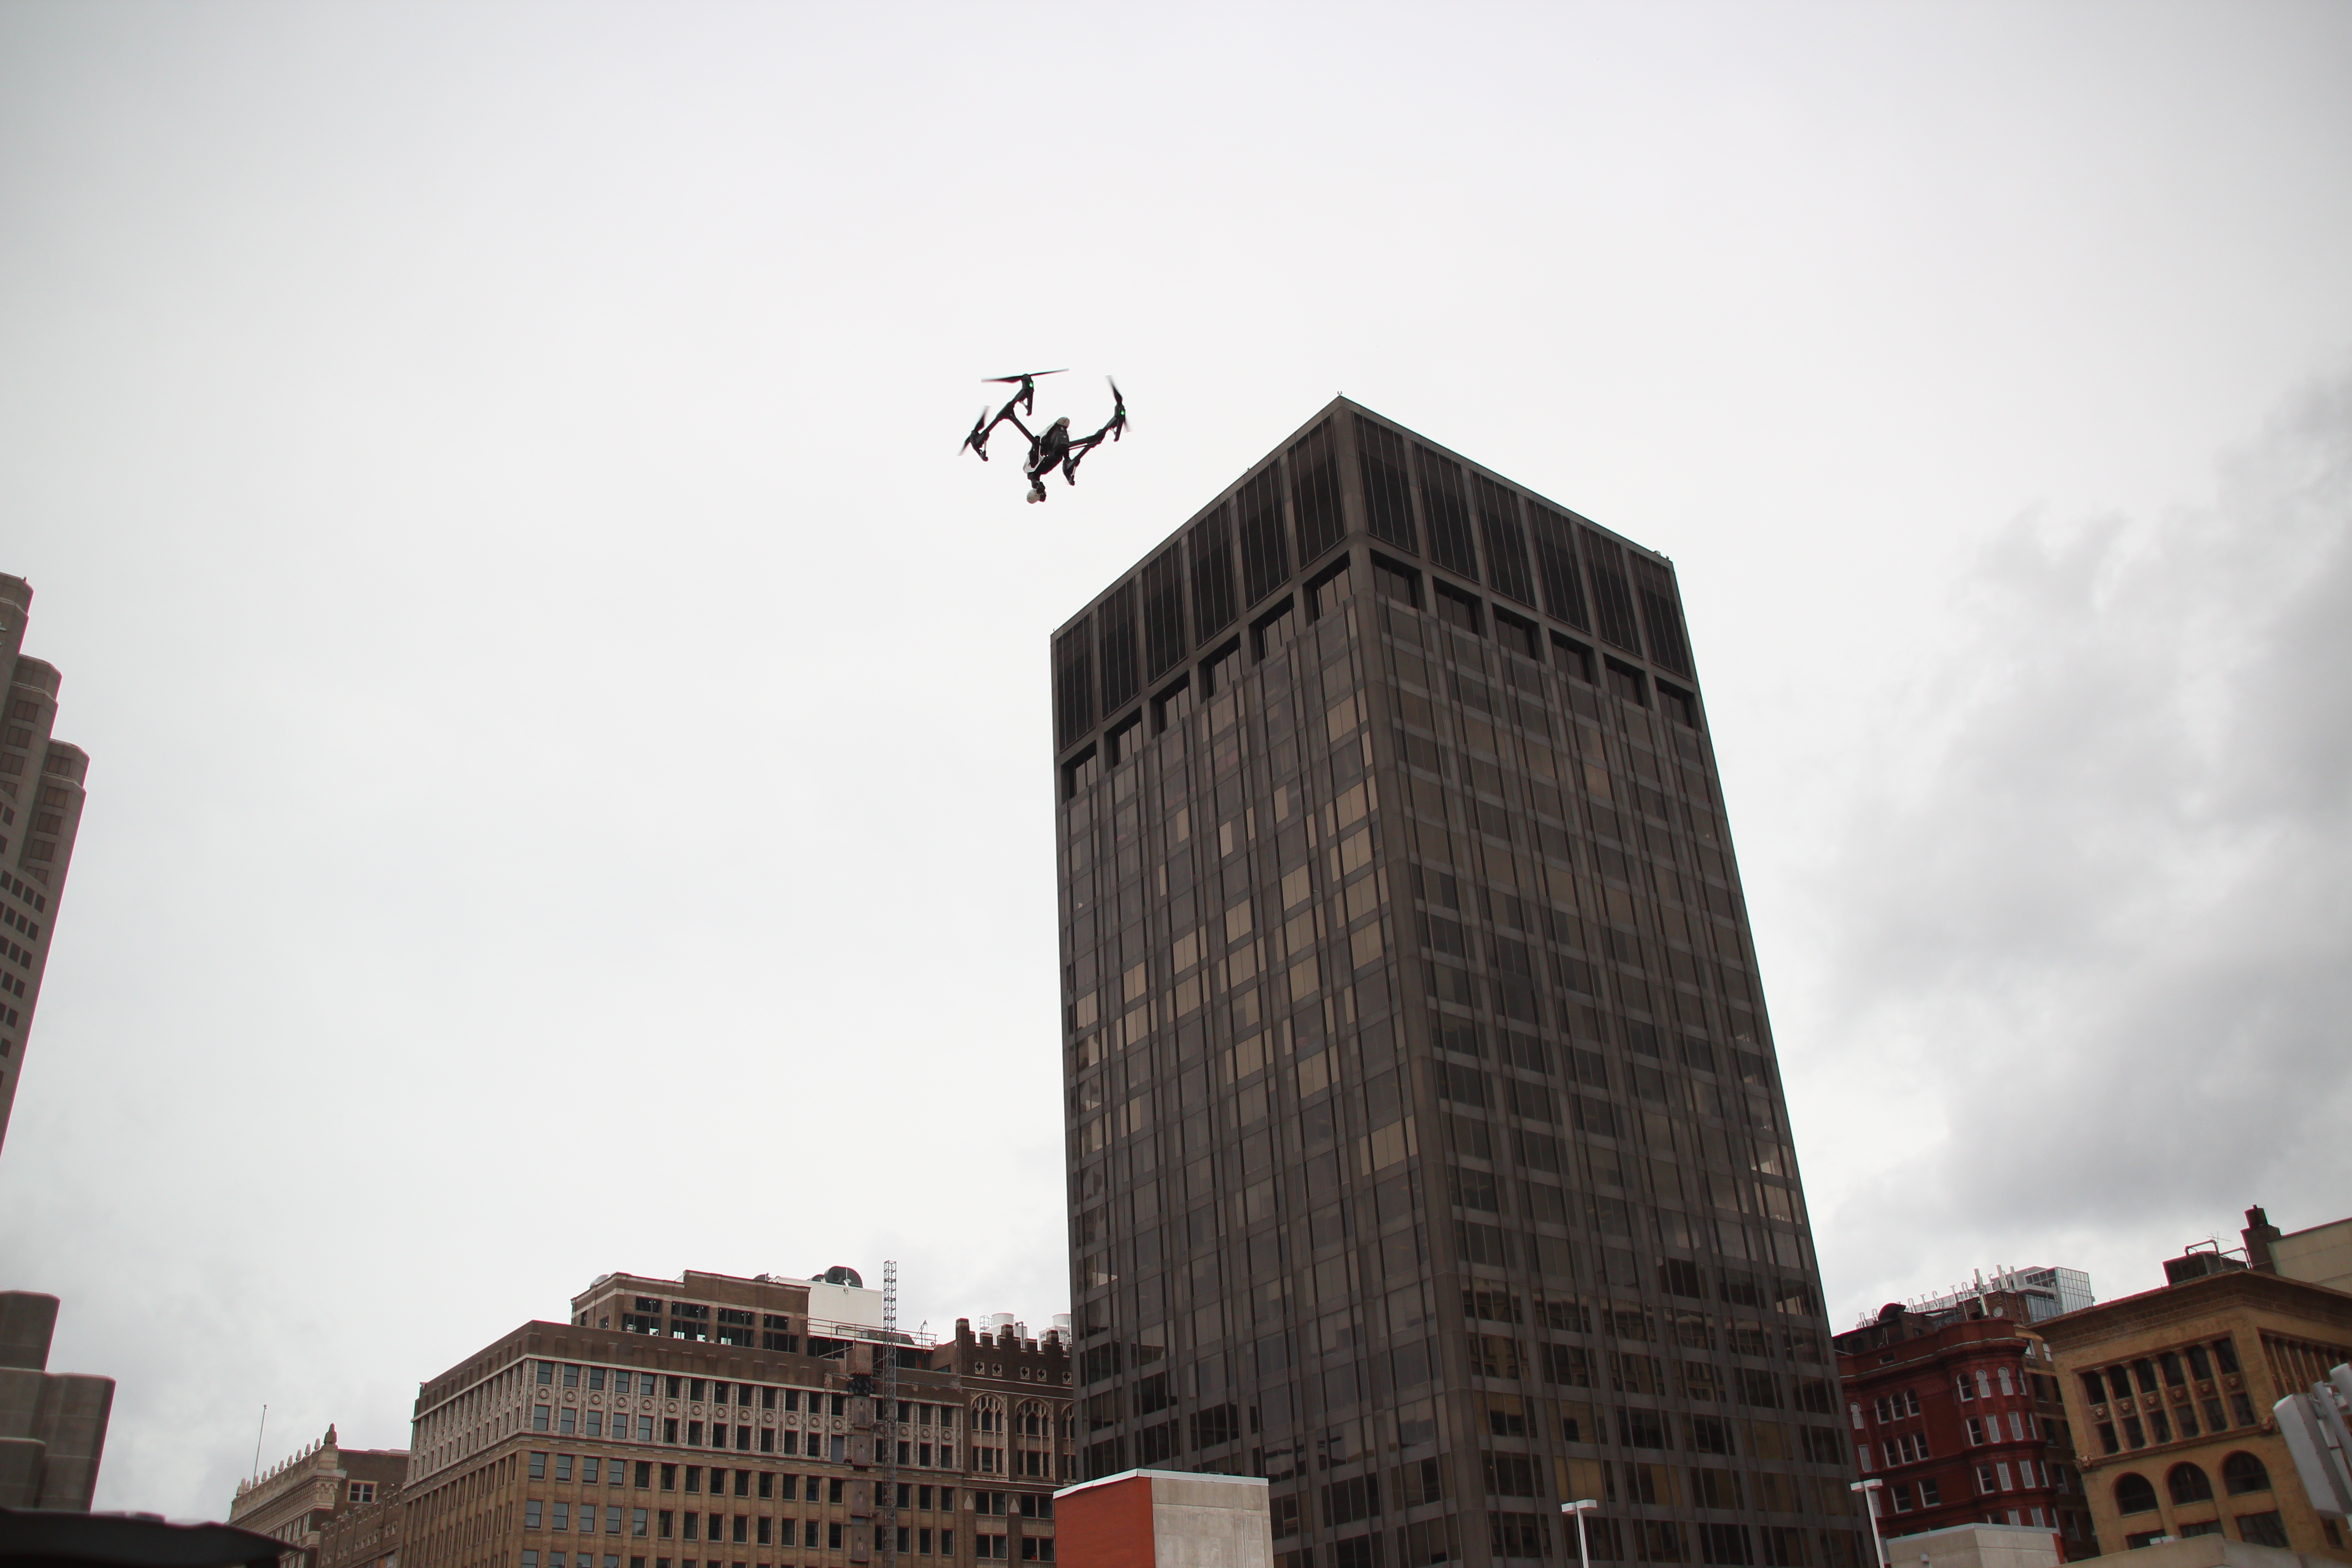
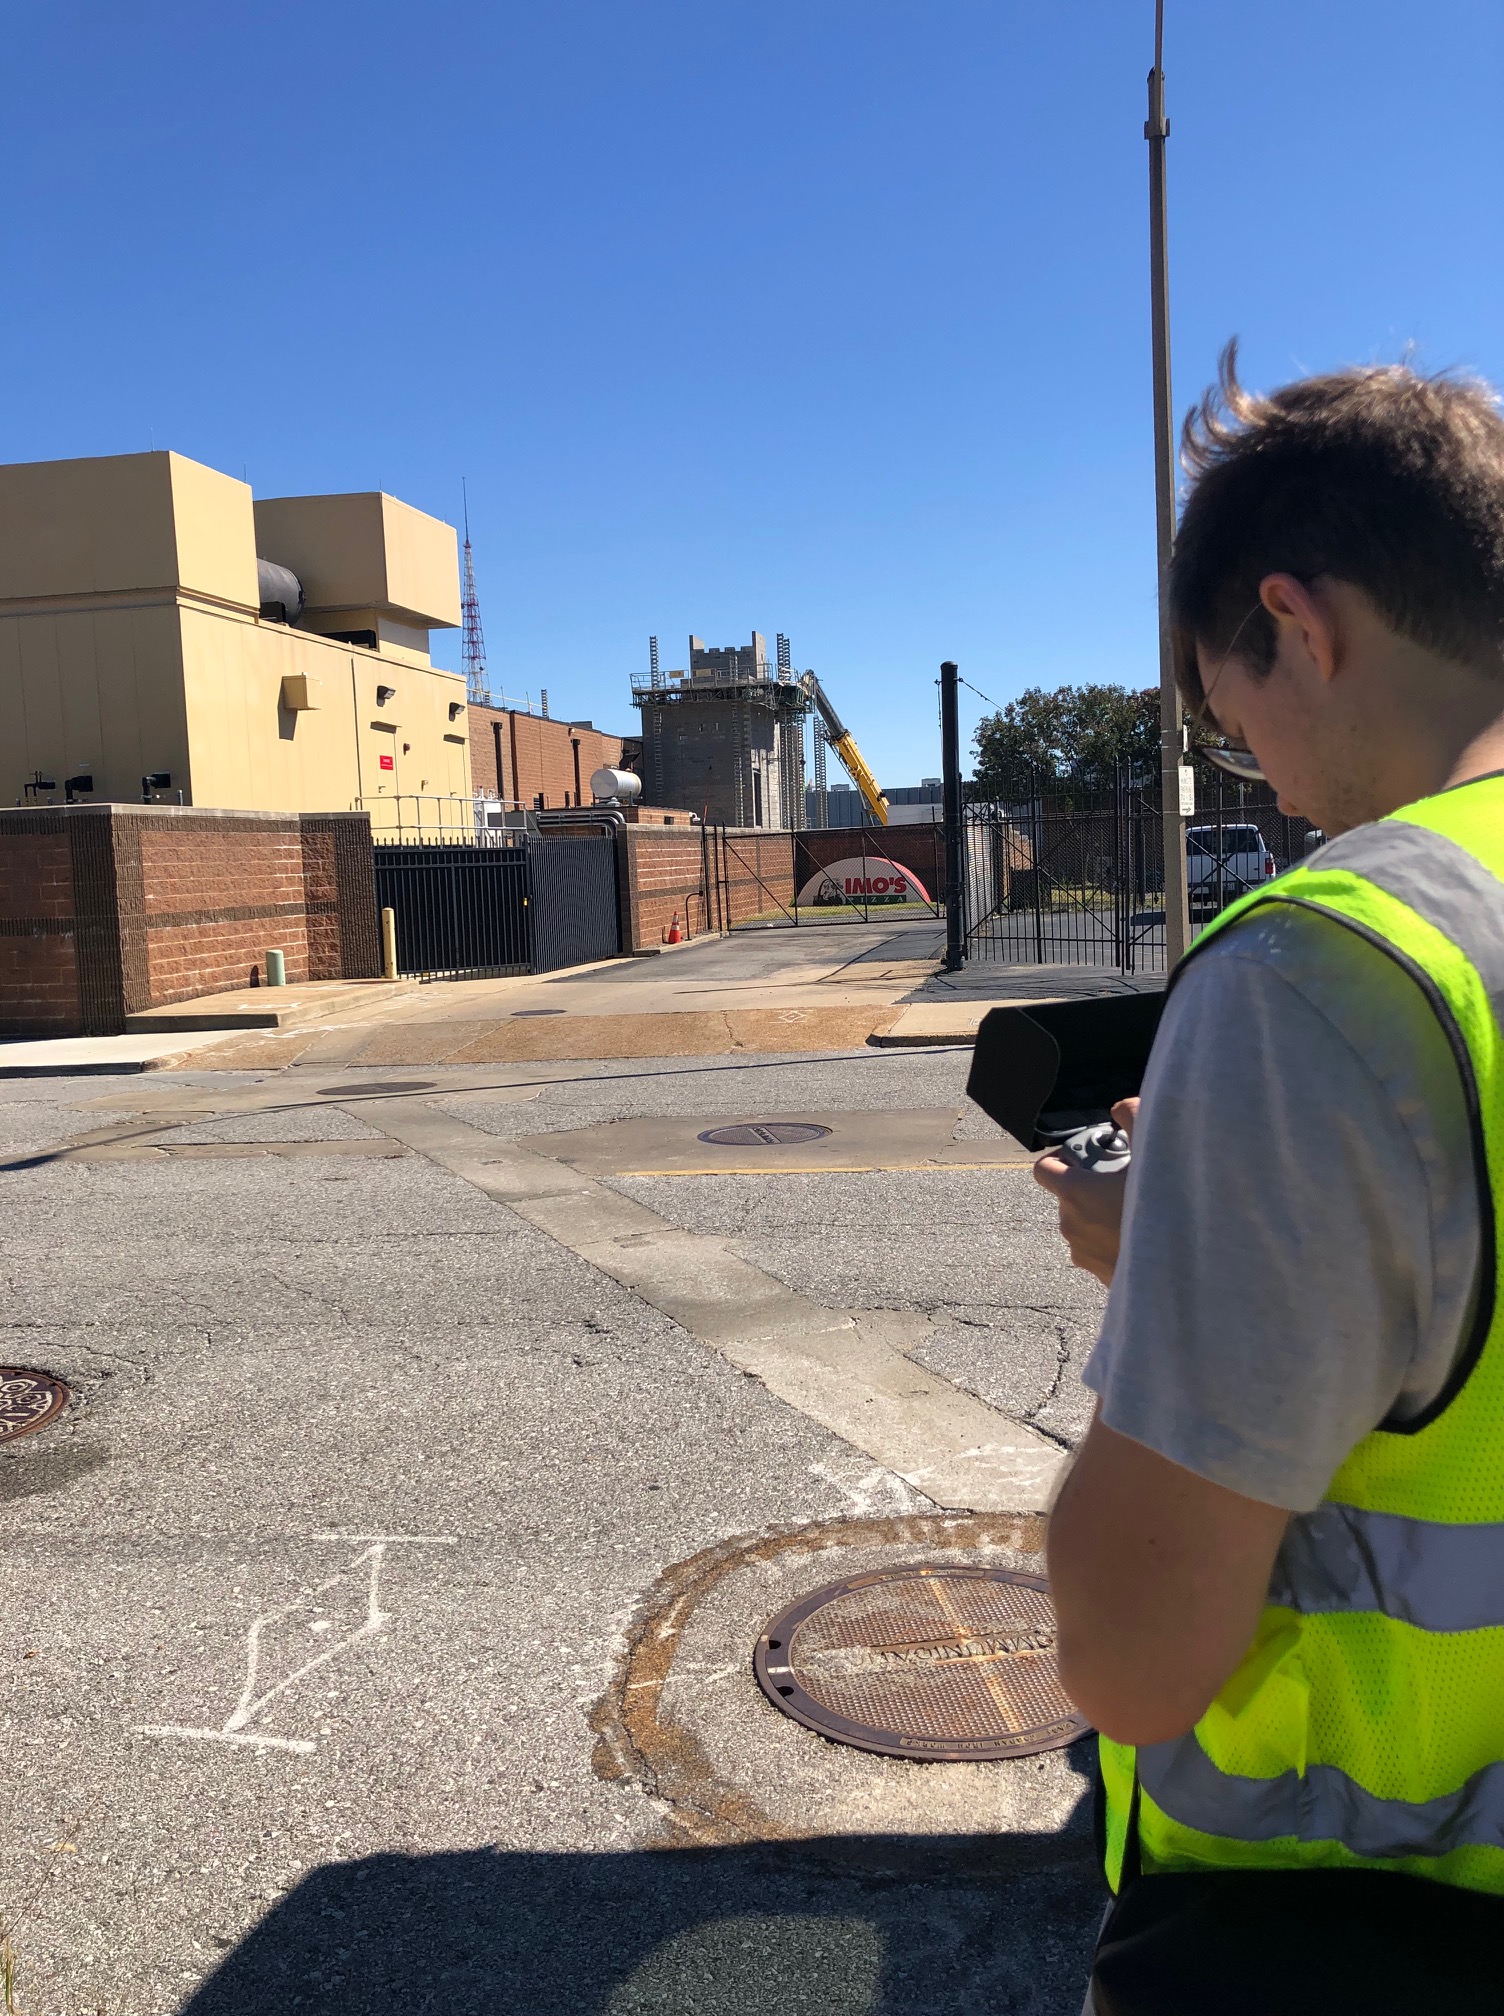
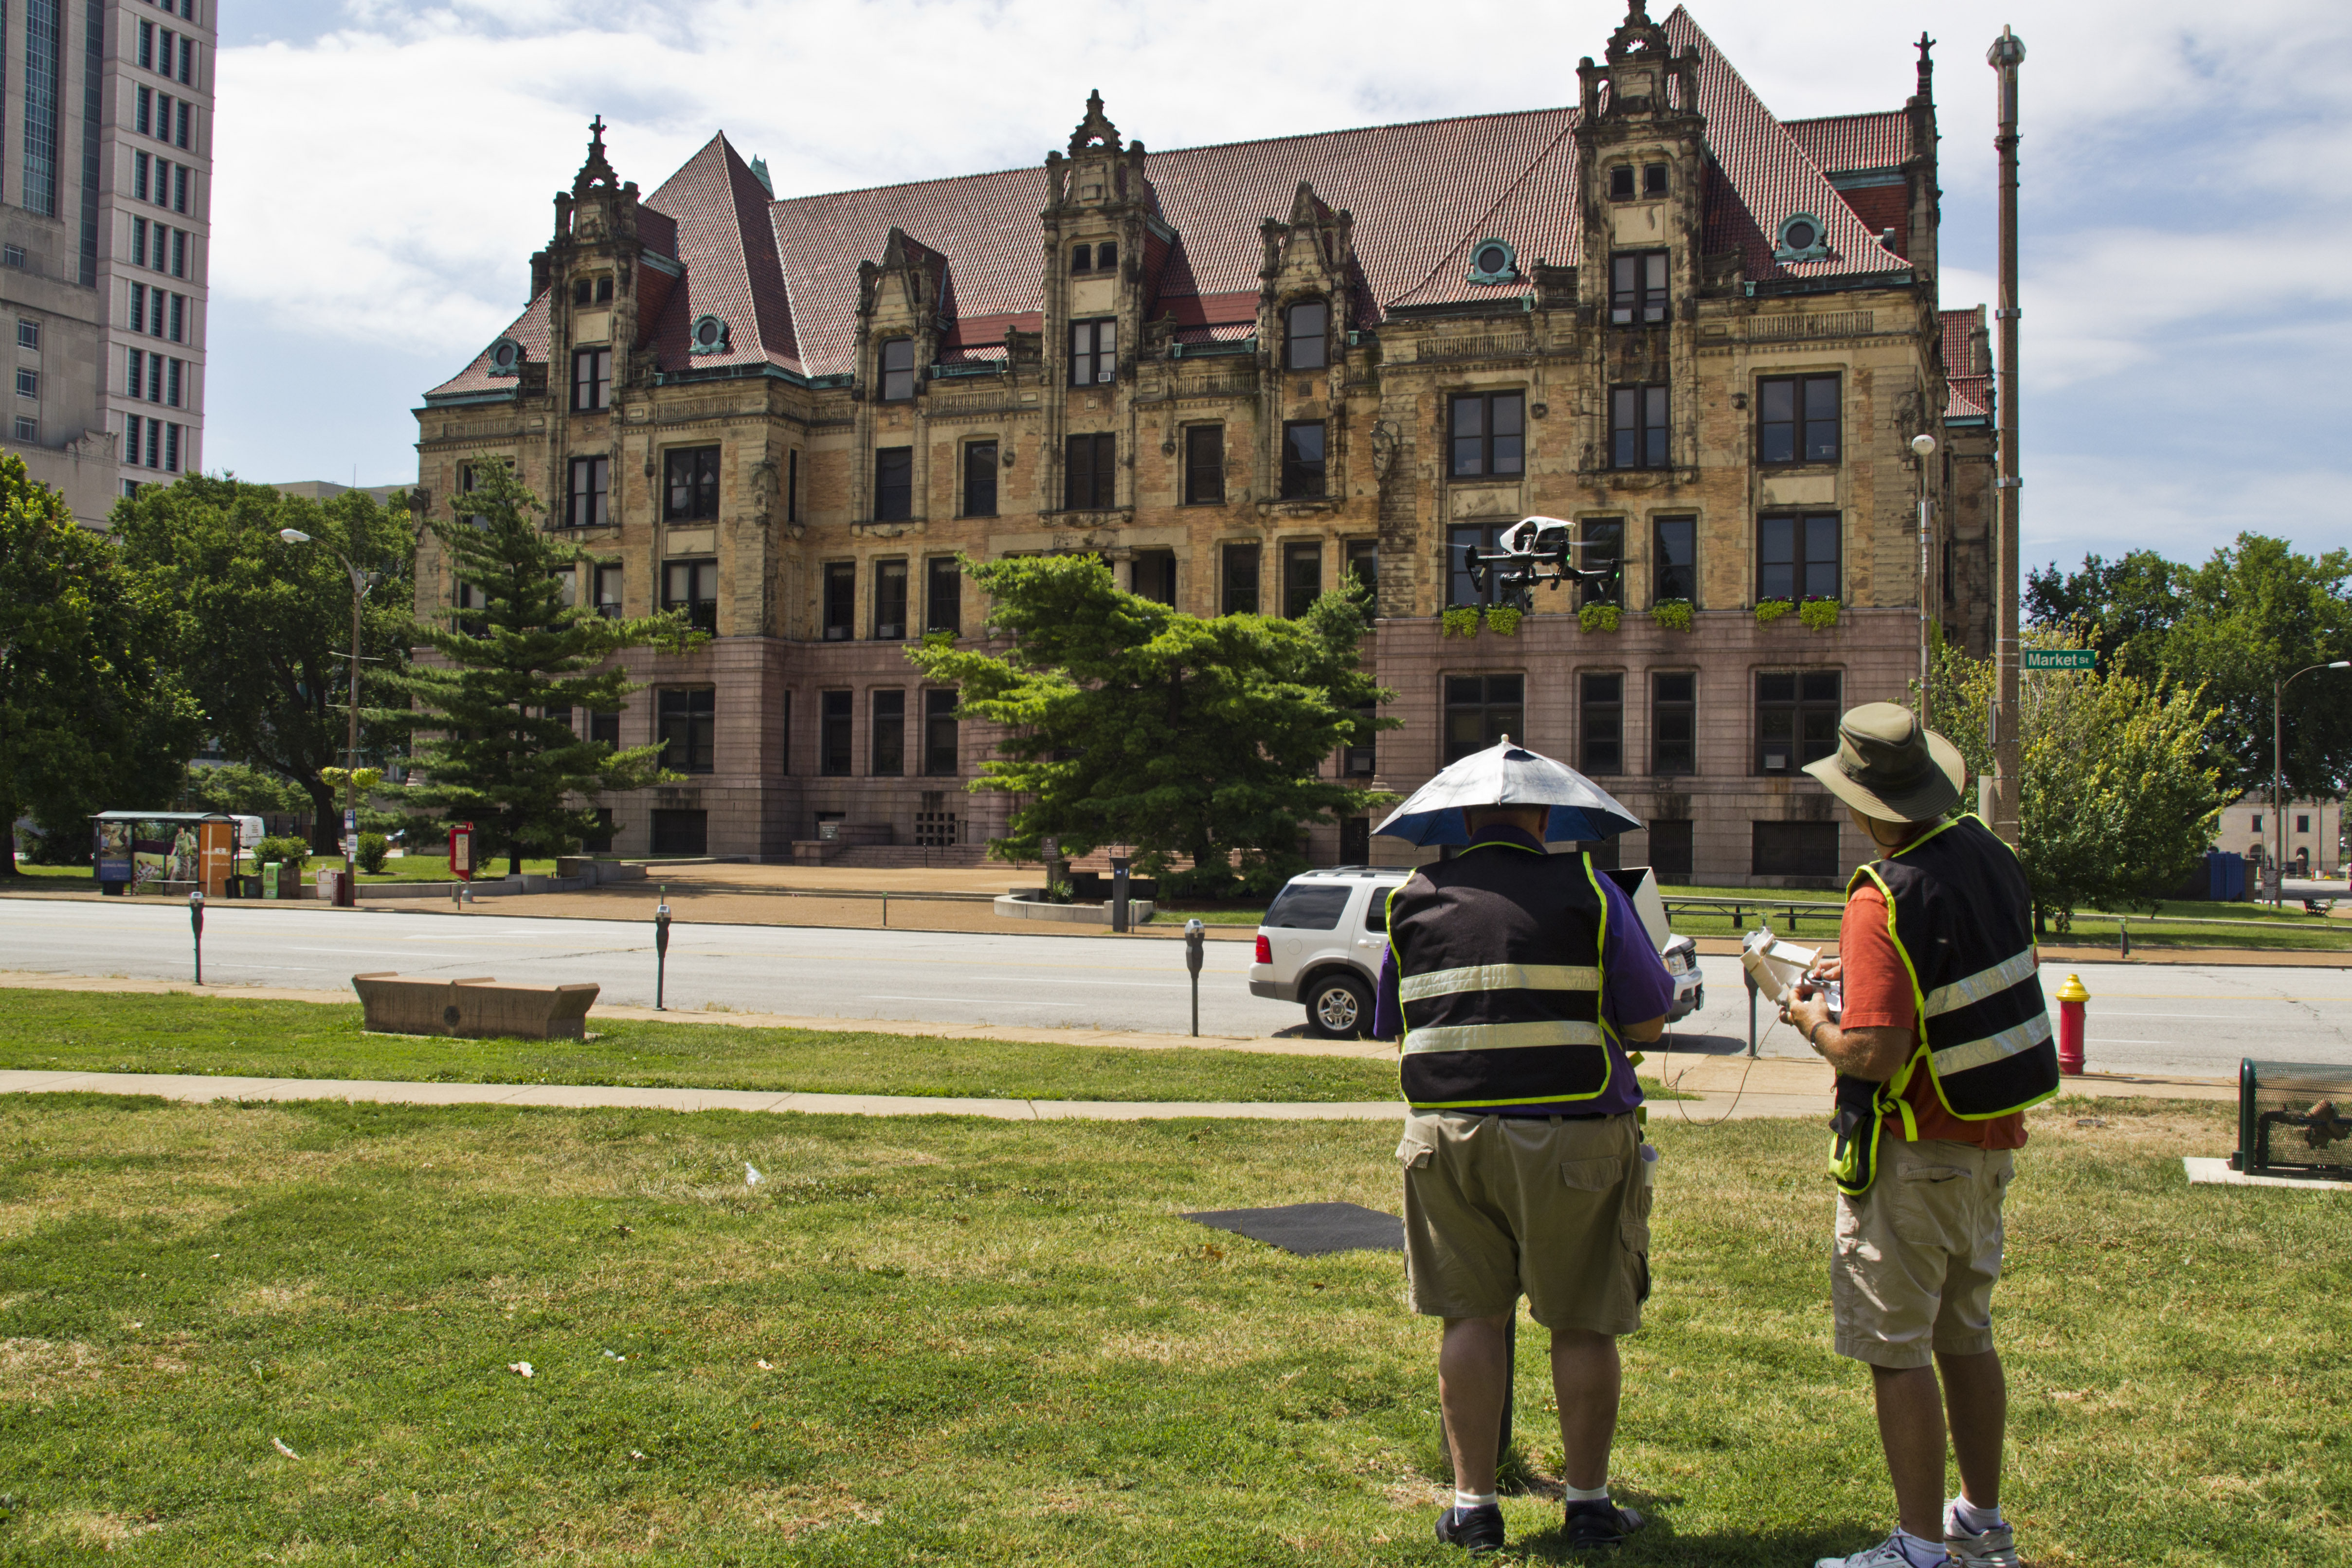
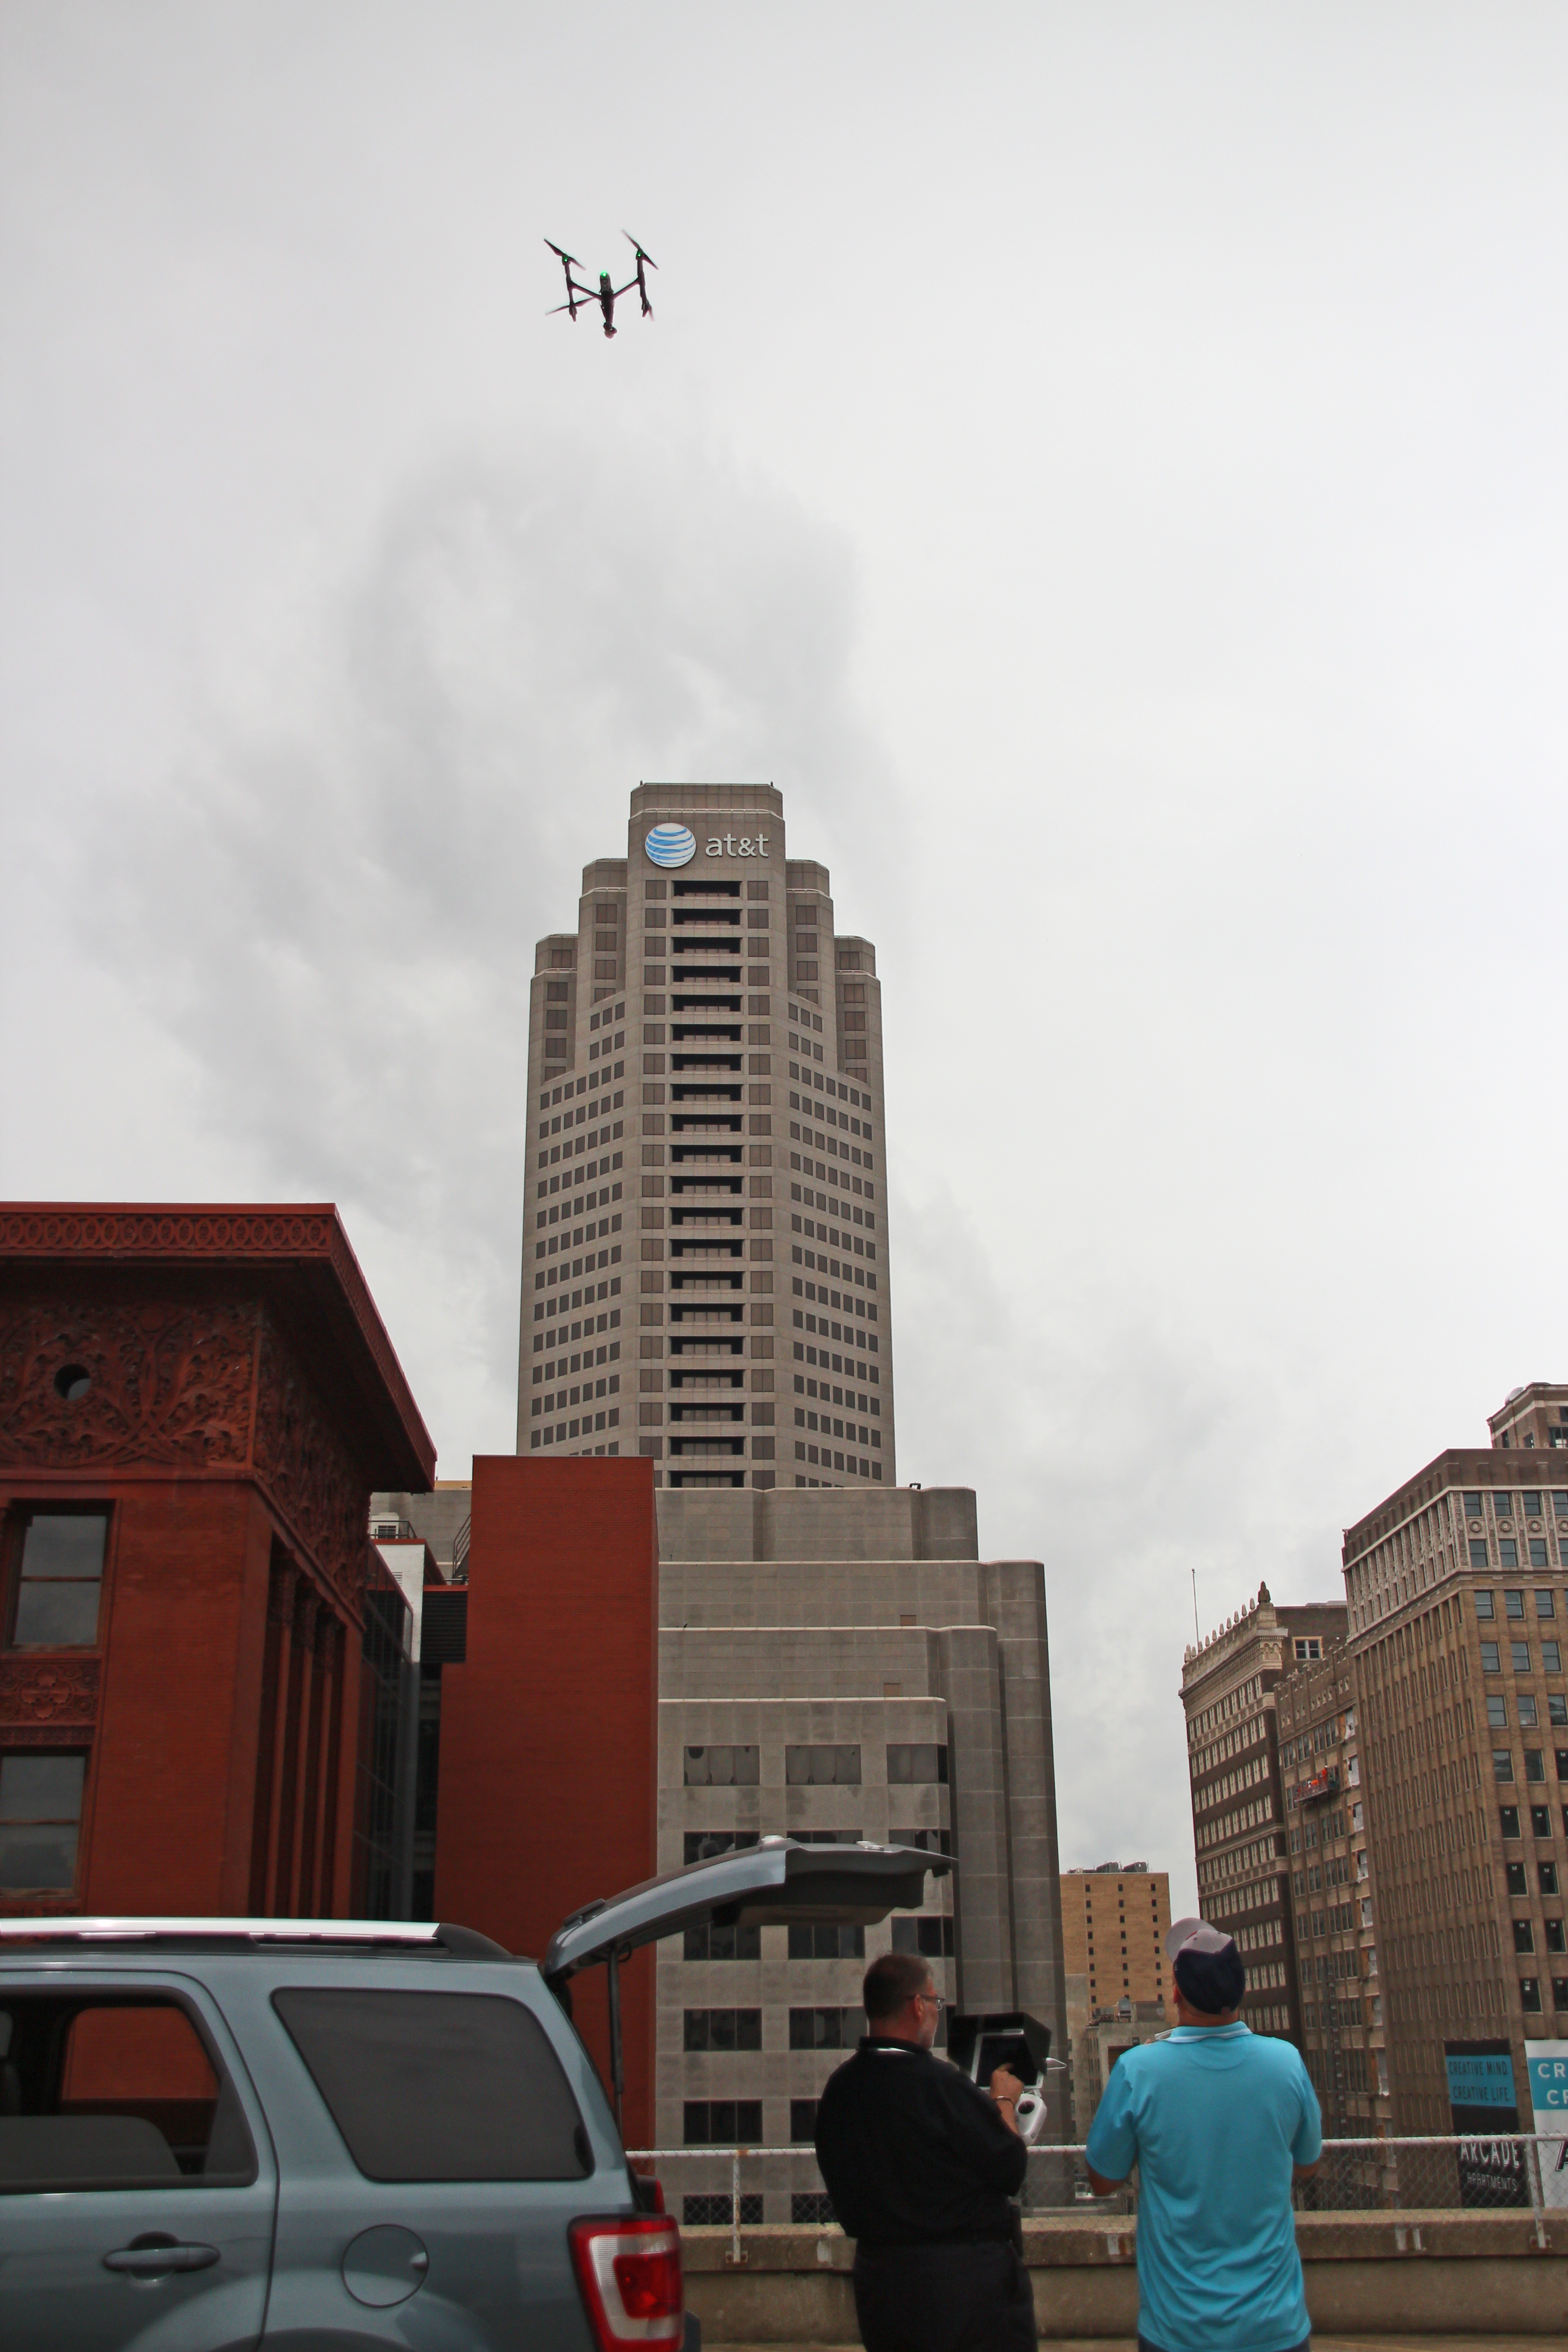
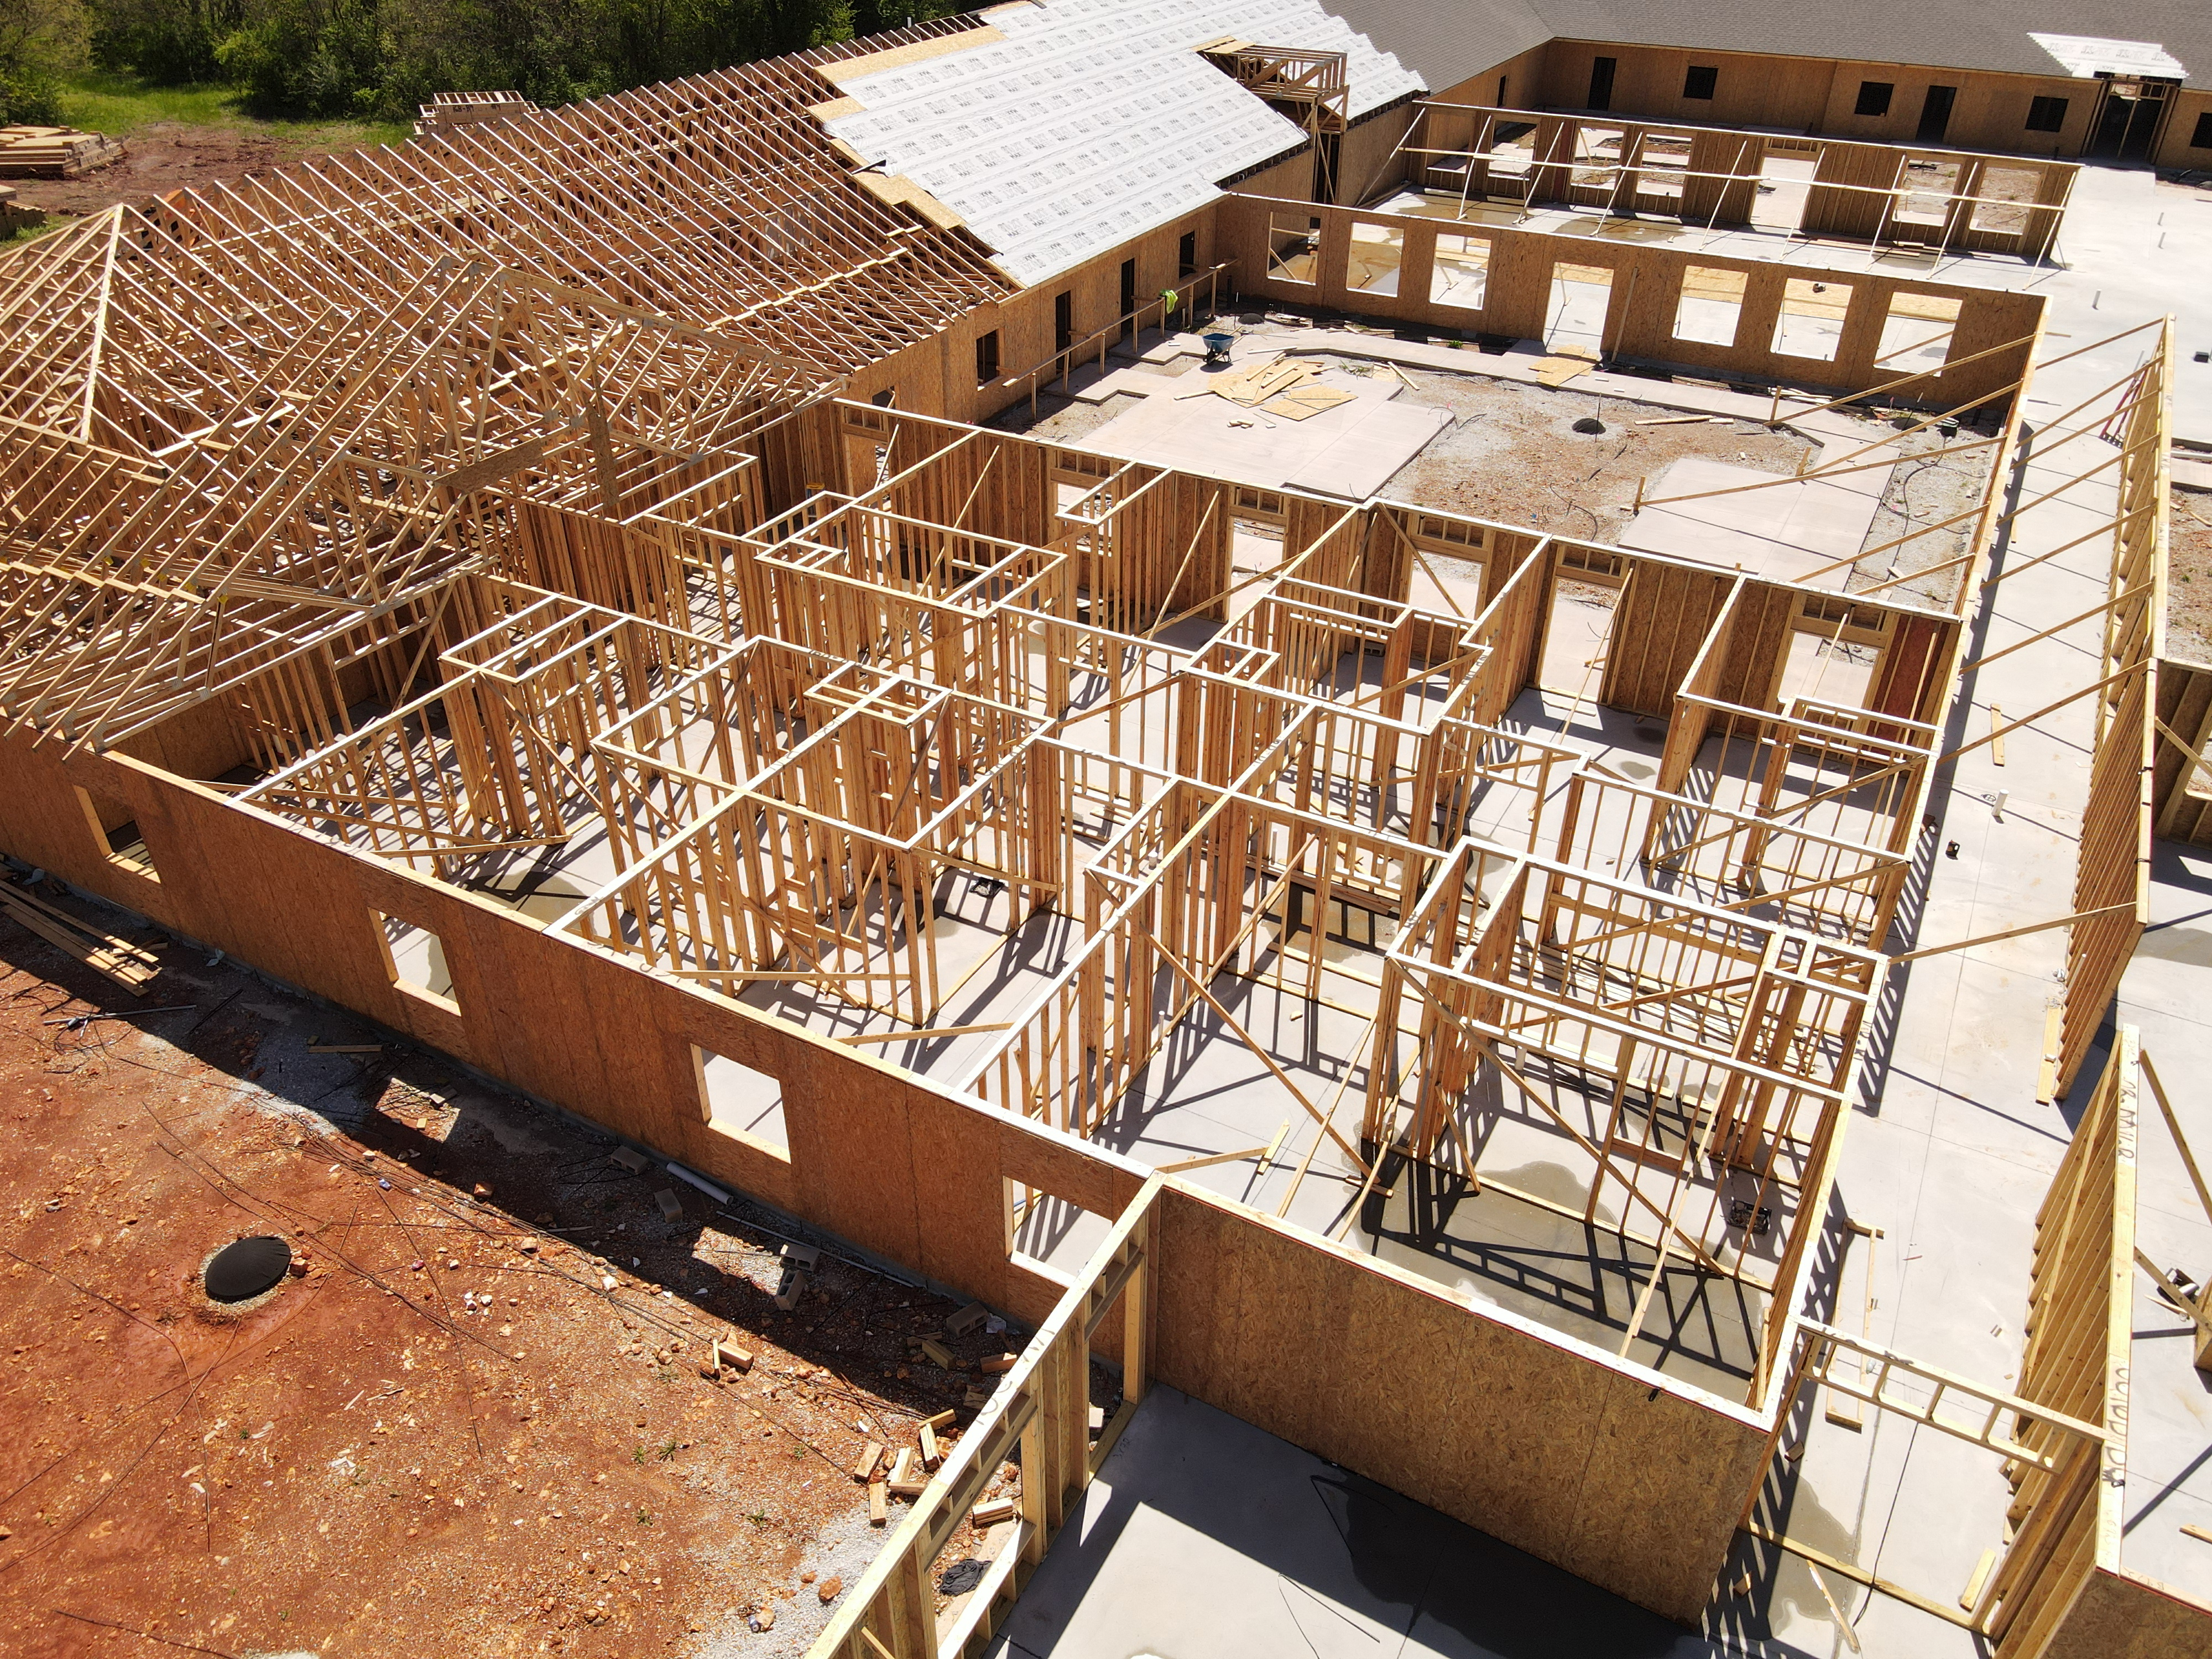
Drone technology has expanded well beyond beautiful aerial views and cinematic flyovers. For businesses and organizations in St. Louis, drones equipped with FLIR thermal imaging and LiDAR capabilities now offer practical, high-value tools for inspection, analysis, mapping, documentation, and strategic visual communication. These are not just specialty services for engineers or surveyors. They are increasingly relevant to facility managers, property owners, contractors, developers, manufacturers, utilities, municipalities, marketers, and decision makers who need better information and stronger visual assets.
When deployed correctly, FLIR thermal drones and LiDAR drones can help organizations see what standard cameras cannot show, measure what ground crews may struggle to capture efficiently, and communicate technical information with clarity. For companies that want actionable aerial intelligence as well as polished media deliverables, these technologies represent a major advantage.
Why FLIR Thermal and LiDAR Drones Matter
Traditional aerial photography and video are extremely effective for showing scale, access, property layout, architecture, and overall site conditions. But there are many business situations where visible-light imagery alone is not enough. A roof may look fine from above while still hiding trapped moisture. A site may appear straightforward from standard video while still requiring far more precise elevation and terrain data for planning or engineering purposes. Large facilities, industrial systems, construction sites, and commercial properties often demand deeper levels of analysis.
That is where FLIR thermal and LiDAR drone services become so valuable.
FLIR thermal imaging detects temperature variations across surfaces and systems. These thermal differences can indicate moisture intrusion, insulation failures, energy loss, overheating components, electrical concerns, or abnormal building behavior. LiDAR, on the other hand, uses laser pulses to generate precise three-dimensional measurements of land, structures, and surface conditions. It is especially valuable when detailed spatial understanding is needed for planning, documentation, modeling, and analysis.
Together, these tools allow organizations to collect far more meaningful aerial information than standard video or photography alone can provide.
Understanding FLIR Thermal Drone Imaging
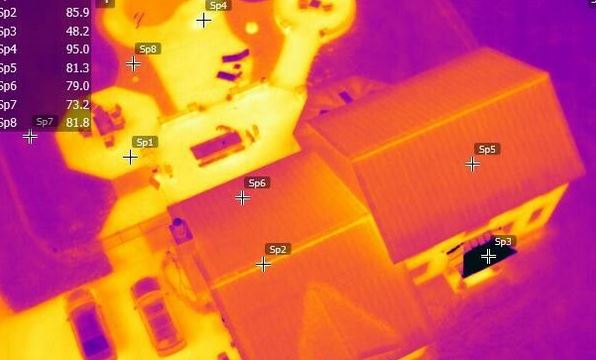
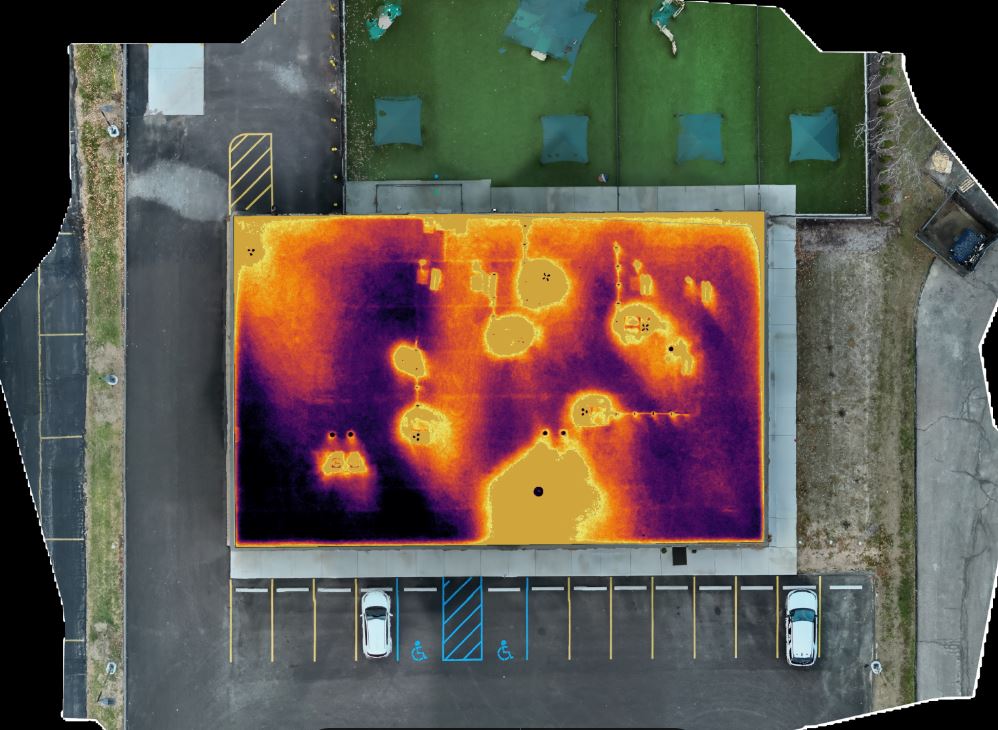
FLIR thermal imaging is one of the most useful drone-based technologies for organizations that need to identify hidden issues quickly and efficiently across large areas. Instead of relying solely on what is visible to the eye, a FLIR-equipped drone measures heat patterns and temperature differences across roofs, walls, equipment, mechanical systems, and outdoor assets.
In commercial and industrial settings, this can be extremely useful. A thermal drone can help detect moisture beneath roof membranes where temperature retention differs from surrounding areas. It can assist in identifying building envelope inconsistencies, overloaded electrical components, uneven HVAC behavior, and heat signatures that may point to maintenance needs or system inefficiencies. For large properties or difficult-to-access surfaces, drones can gather this information far faster and with less disruption than many conventional inspection approaches.
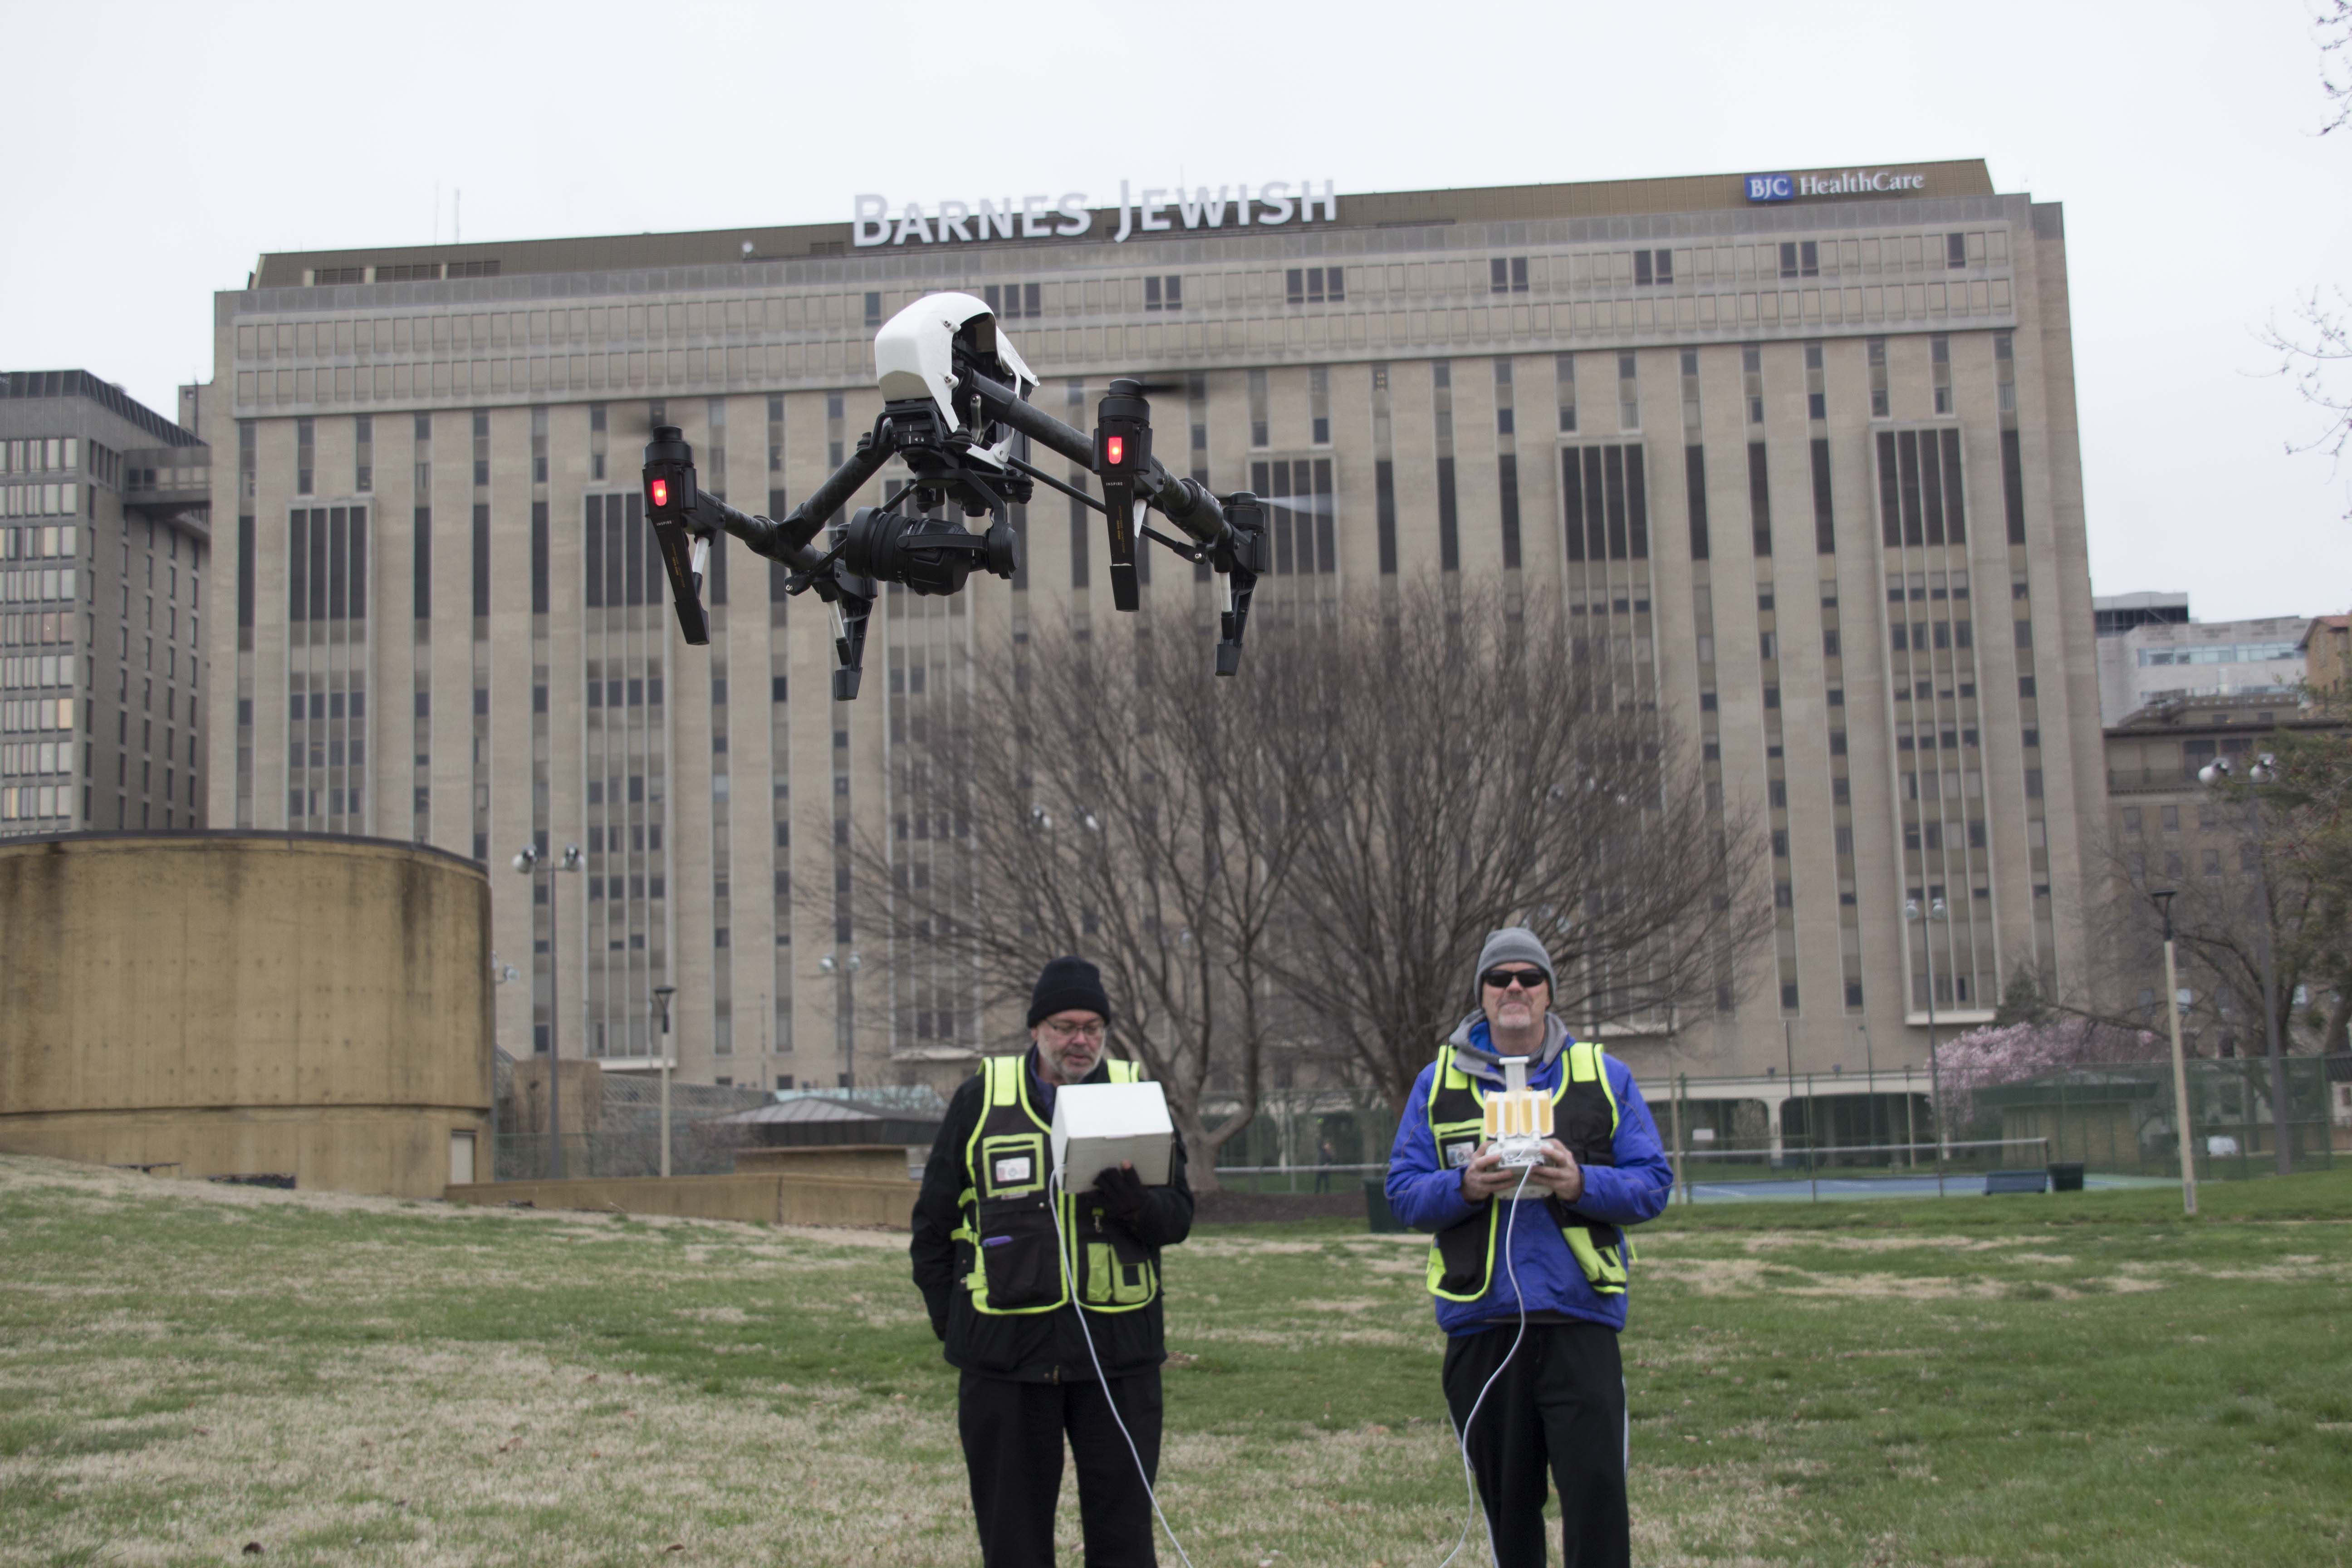
For businesses in St. Louis, this matters because the region has a broad mix of industrial properties, healthcare campuses, educational institutions, office buildings, logistics sites, manufacturing operations, utility infrastructure, and aging commercial buildings. Many of these facilities can benefit from faster, more comprehensive temperature-based aerial reviews.
FLIR Thermal Drones for Roof Inspections
One of the most common and valuable uses for FLIR drone imaging is commercial roof inspection. Large flat roofs often present significant challenges for visual-only assessment. Problems beneath the surface may not be obvious until damage becomes more severe or more expensive to address. Moisture trapped within insulation or membrane systems can create thermal anomalies that show up under the right conditions during a properly planned FLIR inspection flight.
This does not mean thermal drones replace all other inspection methods, but they can provide highly useful guidance for identifying suspect areas, prioritizing follow-up evaluation, and documenting conditions over time. For property managers, facility operators, and building owners, that can mean better planning and more informed maintenance decisions.
The key is not simply owning a thermal camera. The real value comes from understanding when to fly, how environmental conditions affect readings, how building materials behave thermally, and how to separate meaningful anomalies from misleading surface effects. Experienced drone operation and interpretation are essential.
Industrial and Facility Applications for FLIR Thermal Drones
Thermal drones are also highly useful across industrial and institutional environments. Large manufacturing properties, utility assets, warehouses, mechanical systems, and infrastructure sites often include areas that are difficult, time-consuming, or costly to assess manually. Aerial thermal imaging can help teams look for unusual heat signatures, monitor asset conditions, and visualize problem areas in a way that standard photography cannot.
This can be useful for maintenance planning, facilities documentation, pre-project evaluation, or communication with internal stakeholders and outside consultants. In many organizations, one of the greatest values of thermal imaging is that it helps people clearly see the problem. It becomes much easier to explain a roof concern, a heat irregularity, or a suspect system condition when the issue can be shown visually rather than described only in text.
For organizations that need to support decisions with clear documentation, FLIR drone imagery can become an important business tool.
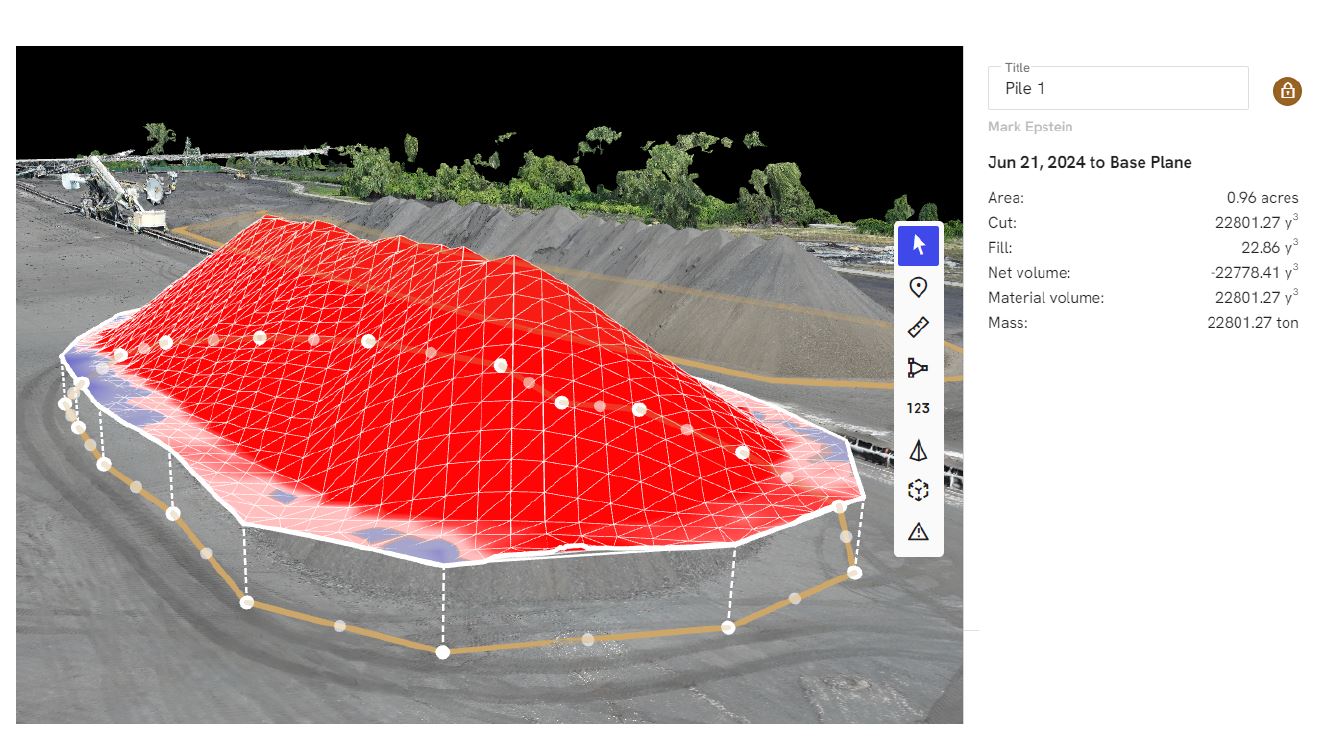
What LiDAR Drones Bring to the Table
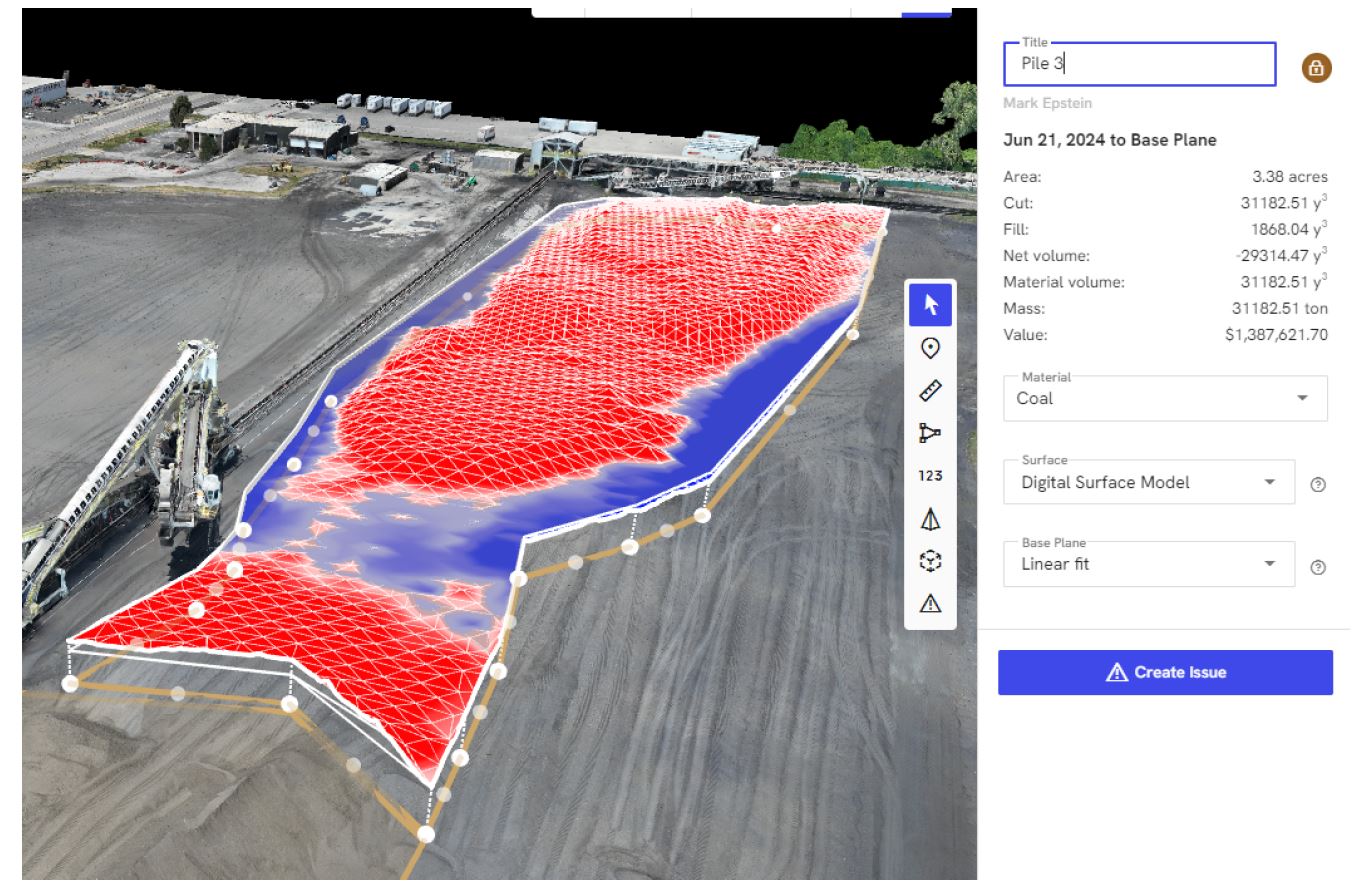
LiDAR offers a different but equally powerful set of advantages. While thermal imaging focuses on heat patterns, LiDAR focuses on spatial precision. A LiDAR drone emits laser pulses and measures the return of those pulses to generate detailed point cloud data and highly accurate three-dimensional representations of land and structures.
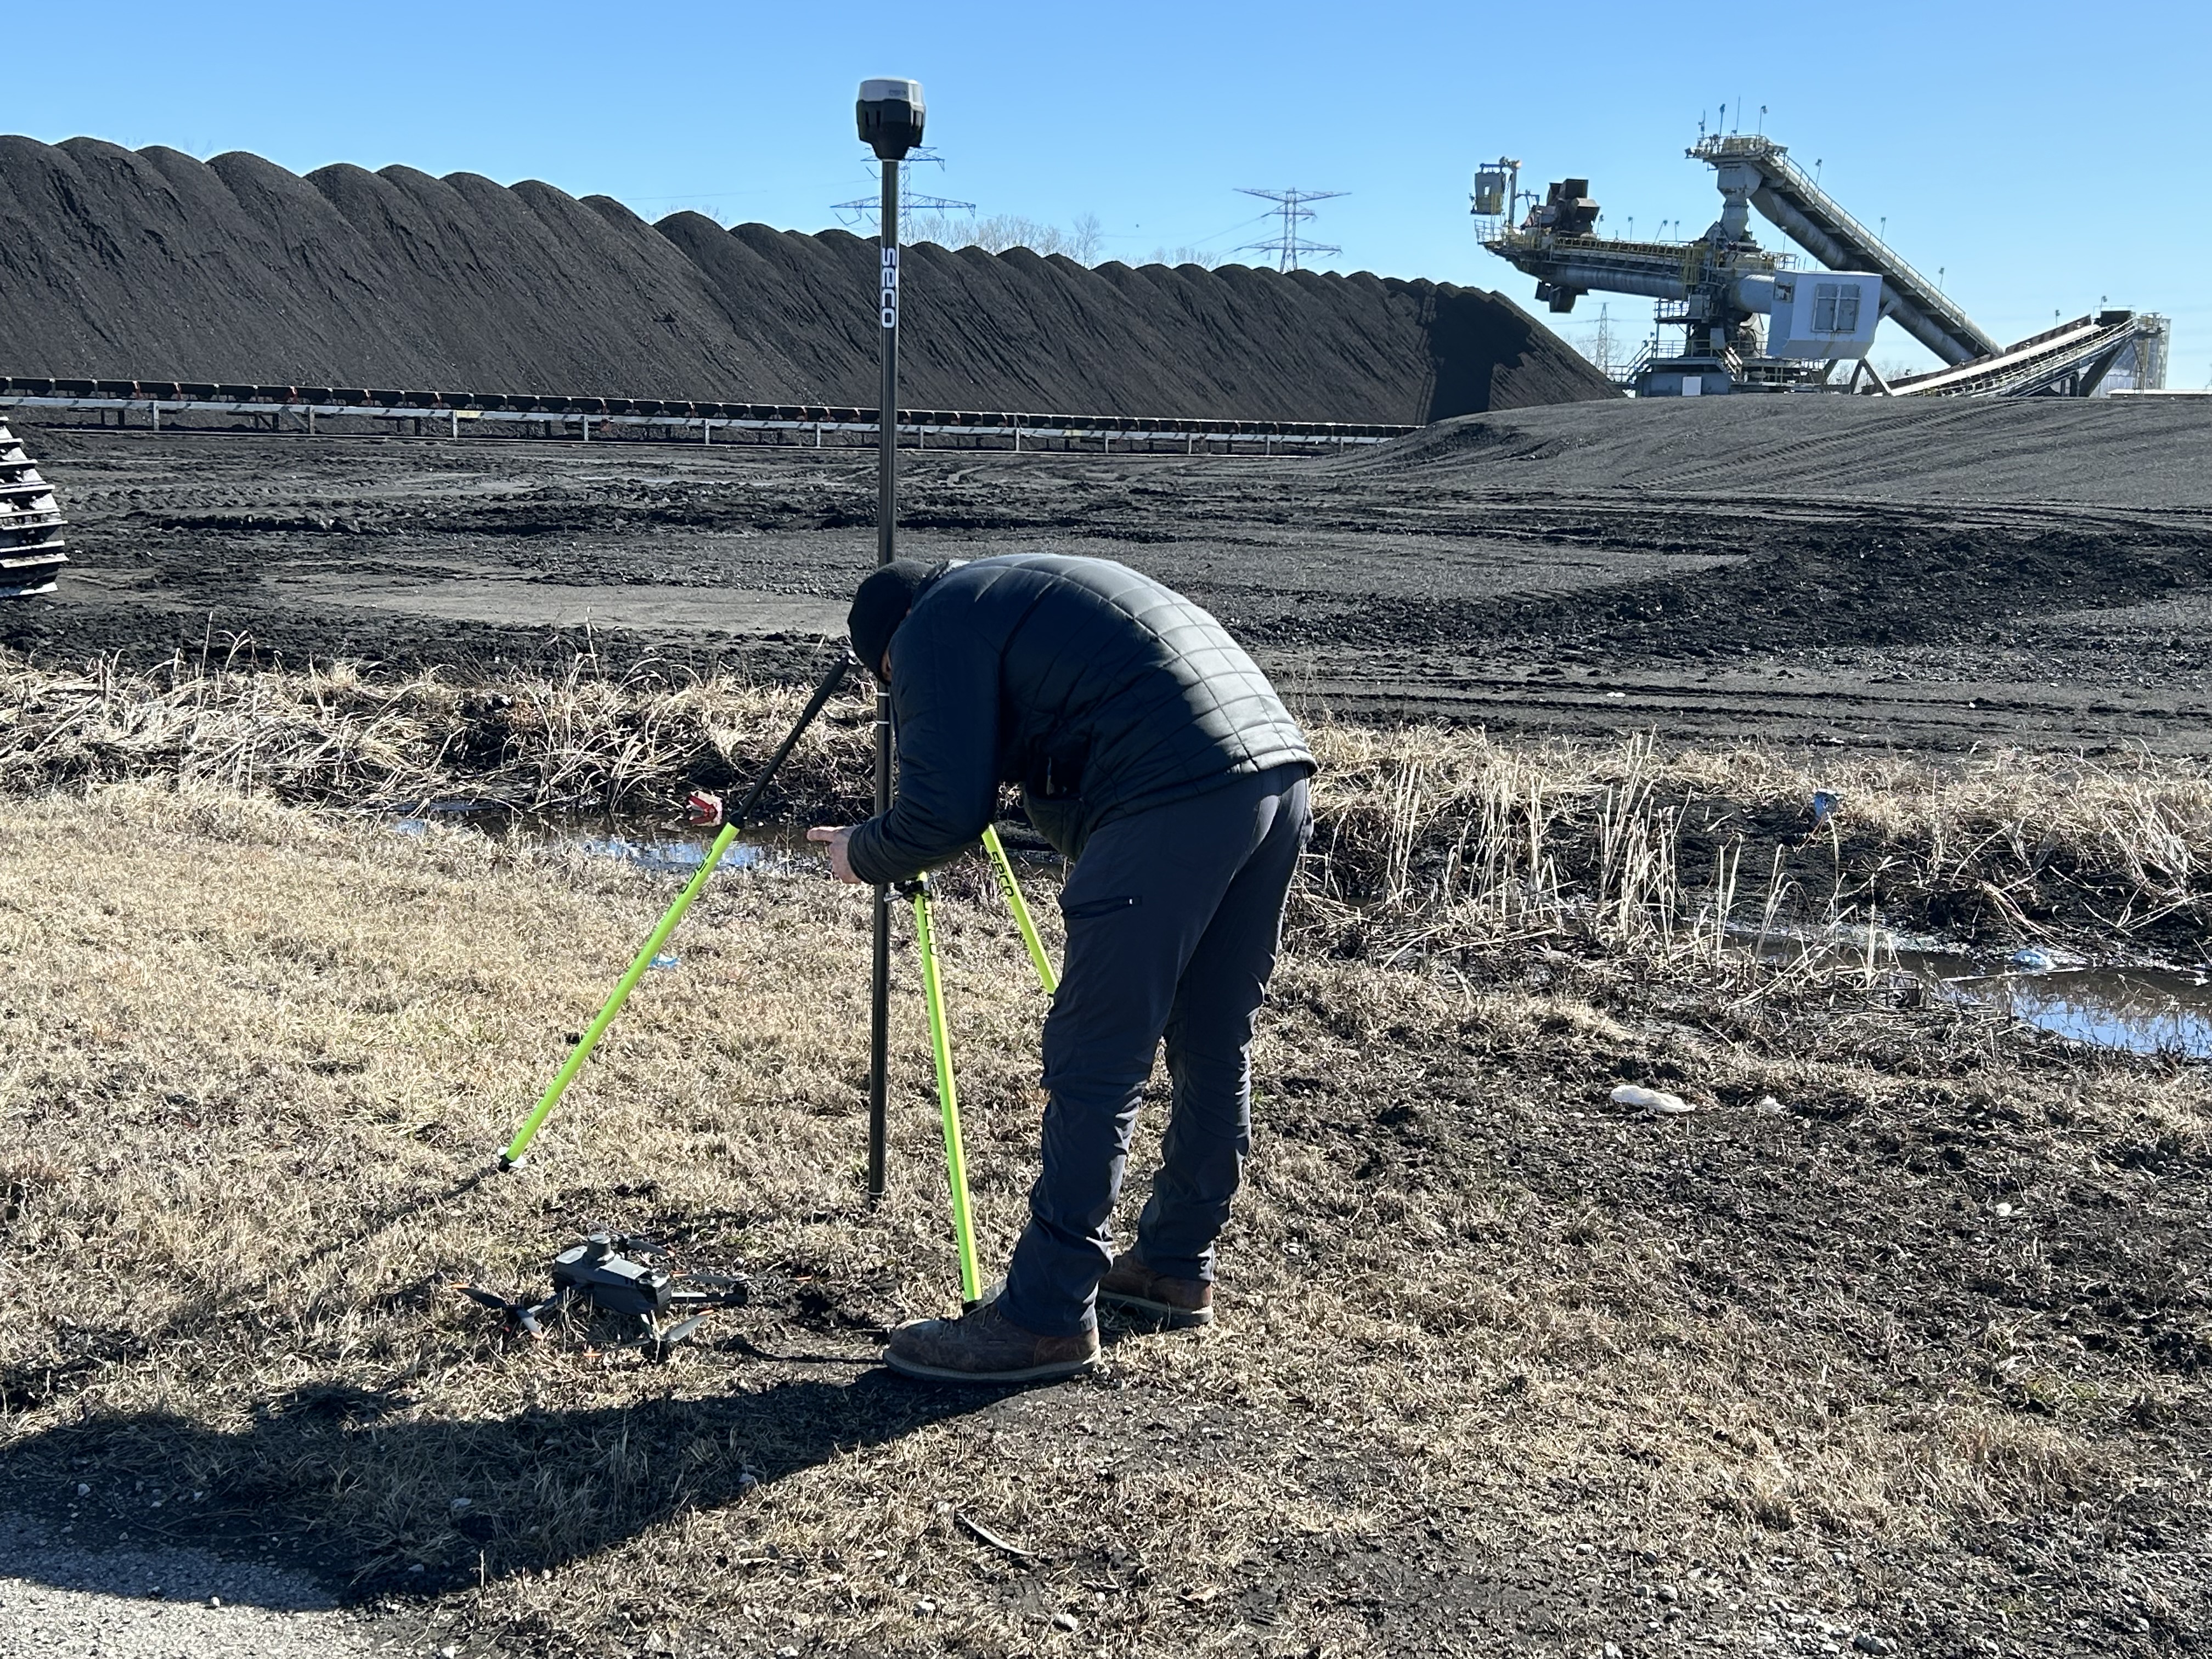
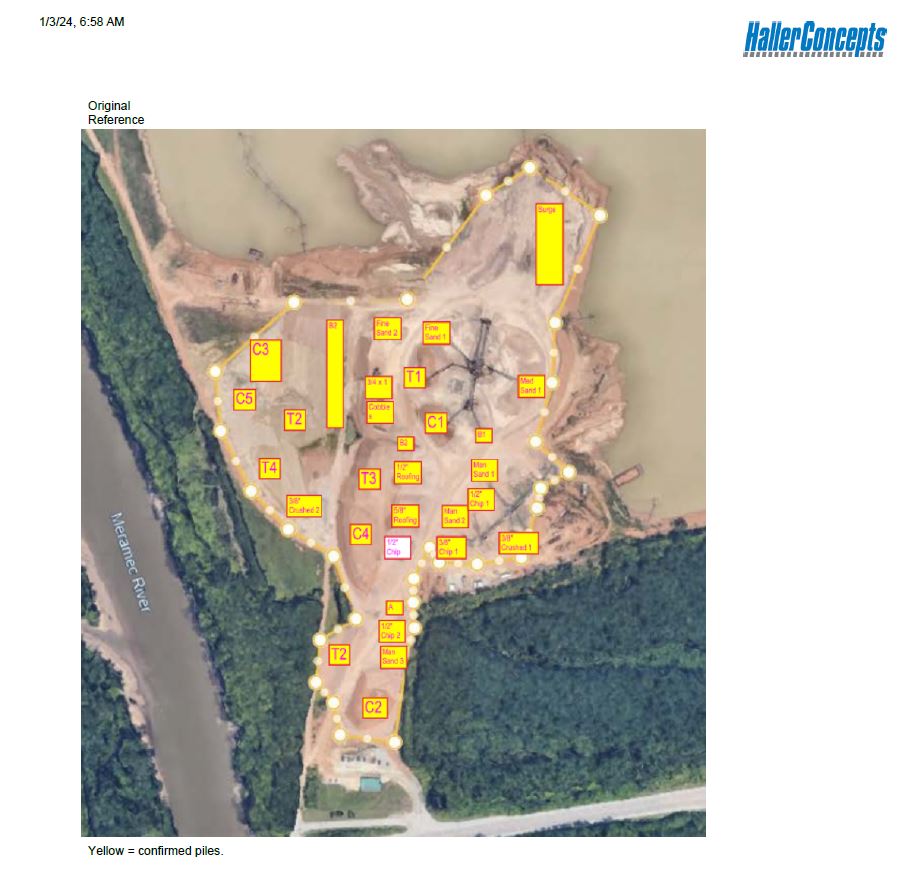
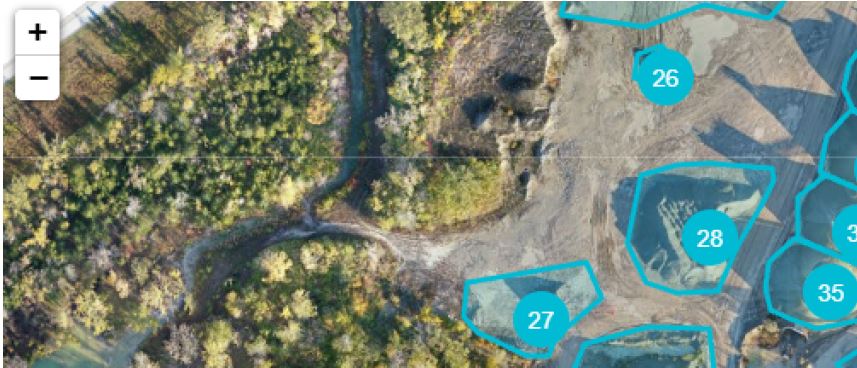
This makes LiDAR particularly valuable for projects where precision mapping, terrain understanding, elevation data, or spatial measurement are critical. It is widely useful in construction, development, engineering support, infrastructure assessment, site planning, corridor mapping, and large-property documentation.
Unlike standard aerial photography, which relies on visible surface imagery, LiDAR captures measurable geometry. That allows businesses and organizations to move beyond general impressions and into usable spatial intelligence. In some environments, especially where vegetation, uneven terrain, or complex surface relationships are involved, LiDAR can provide clearer and more dependable data than methods based entirely on standard imagery.
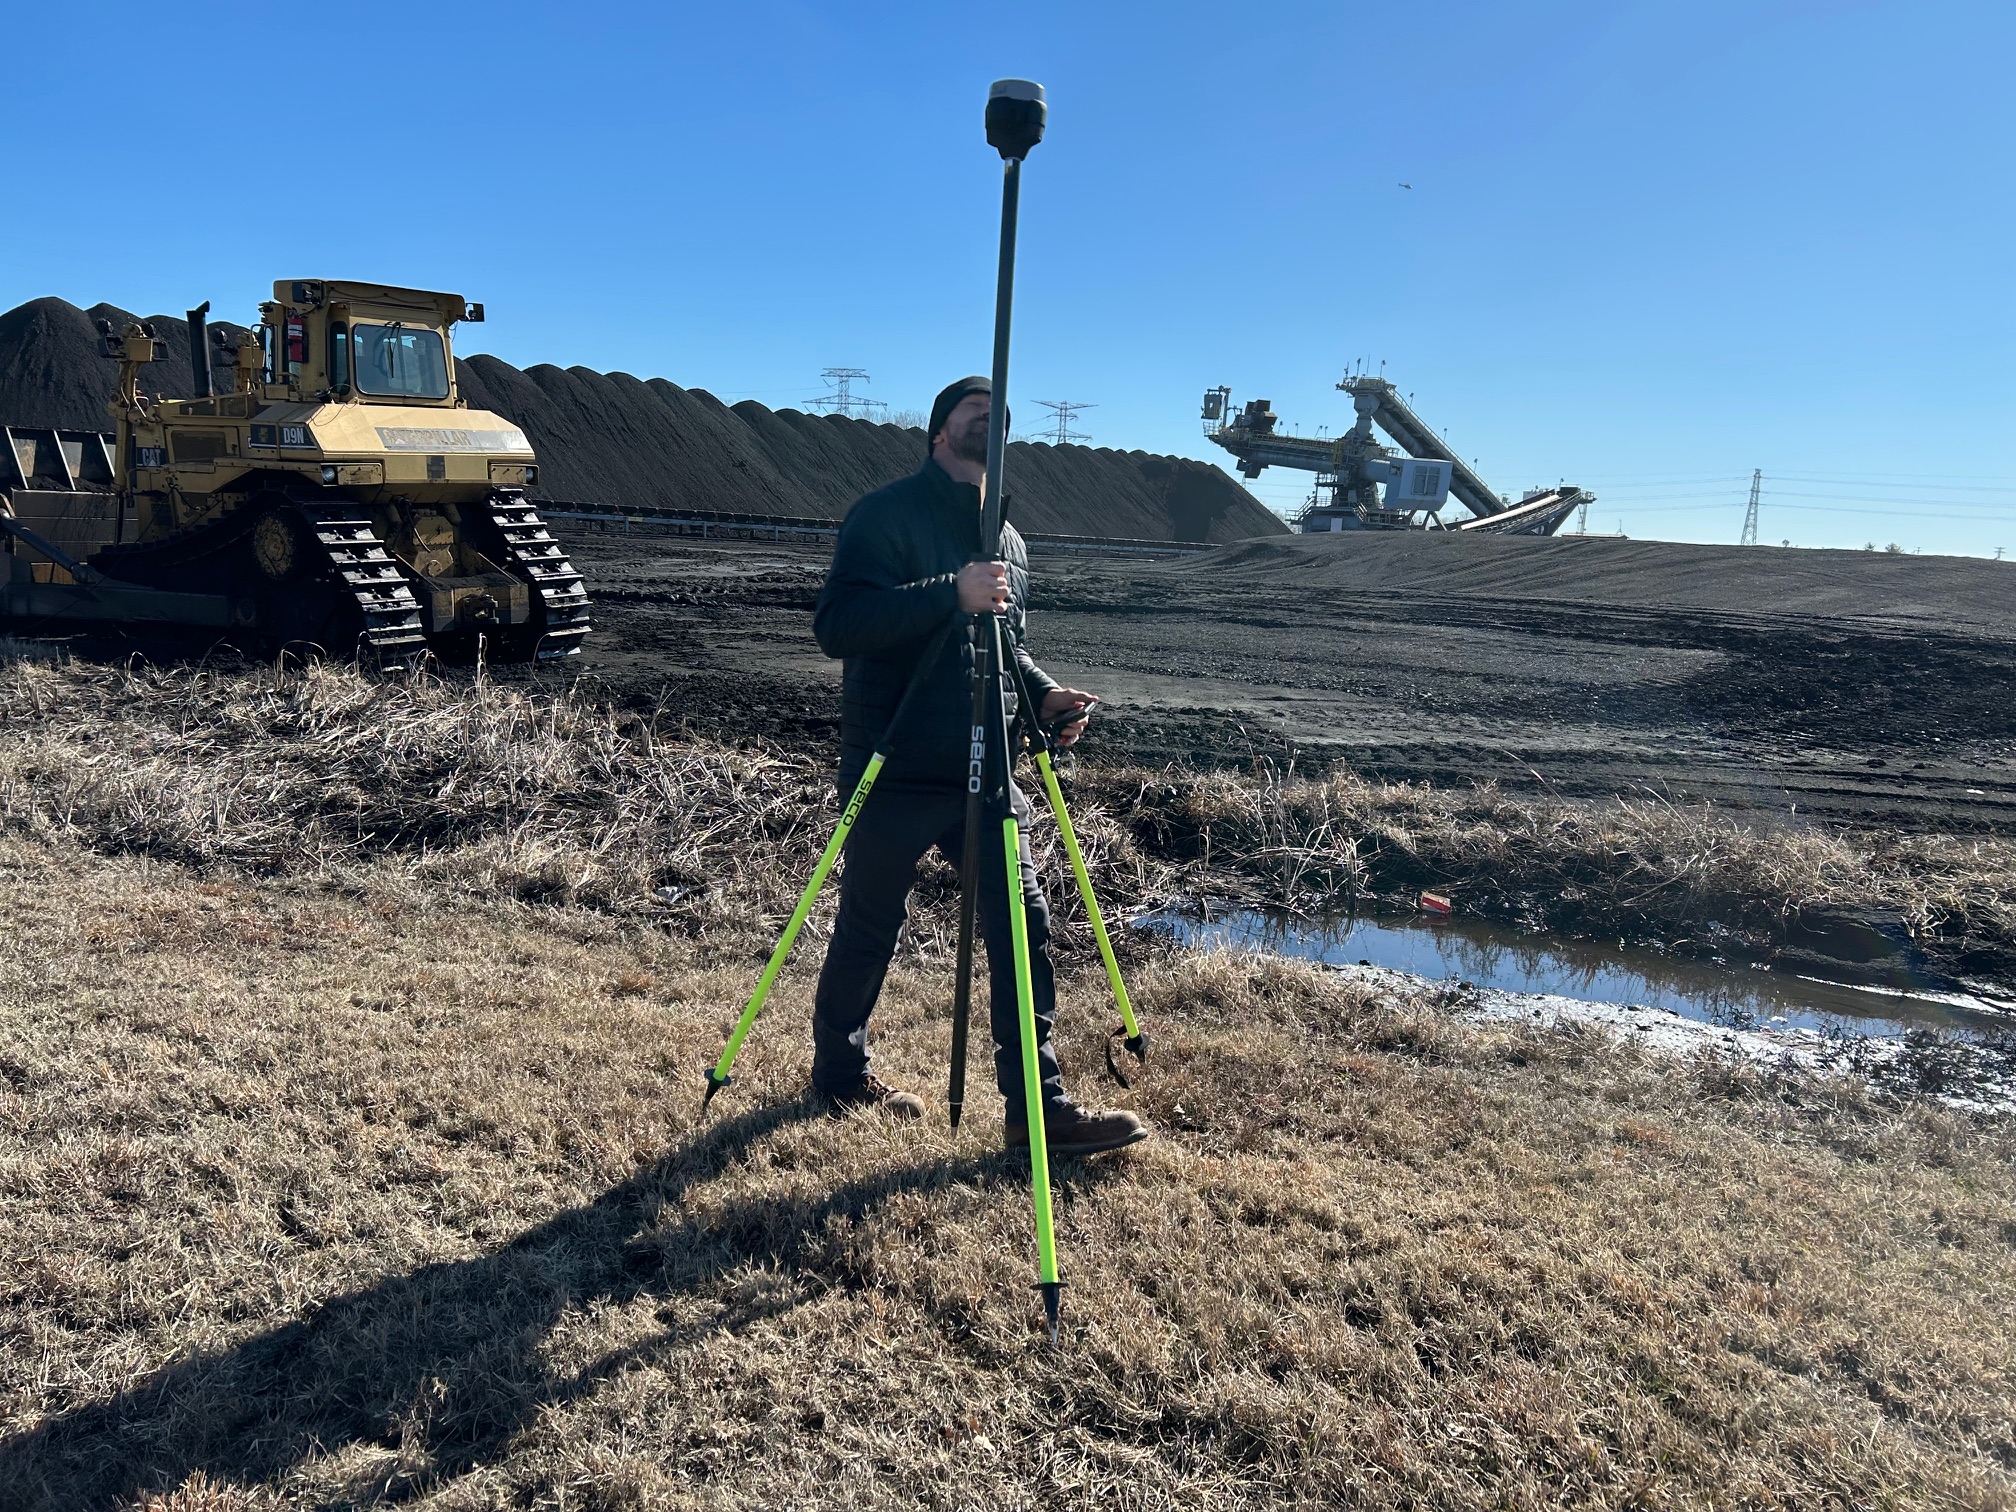
LiDAR Drone Uses in St. Louis
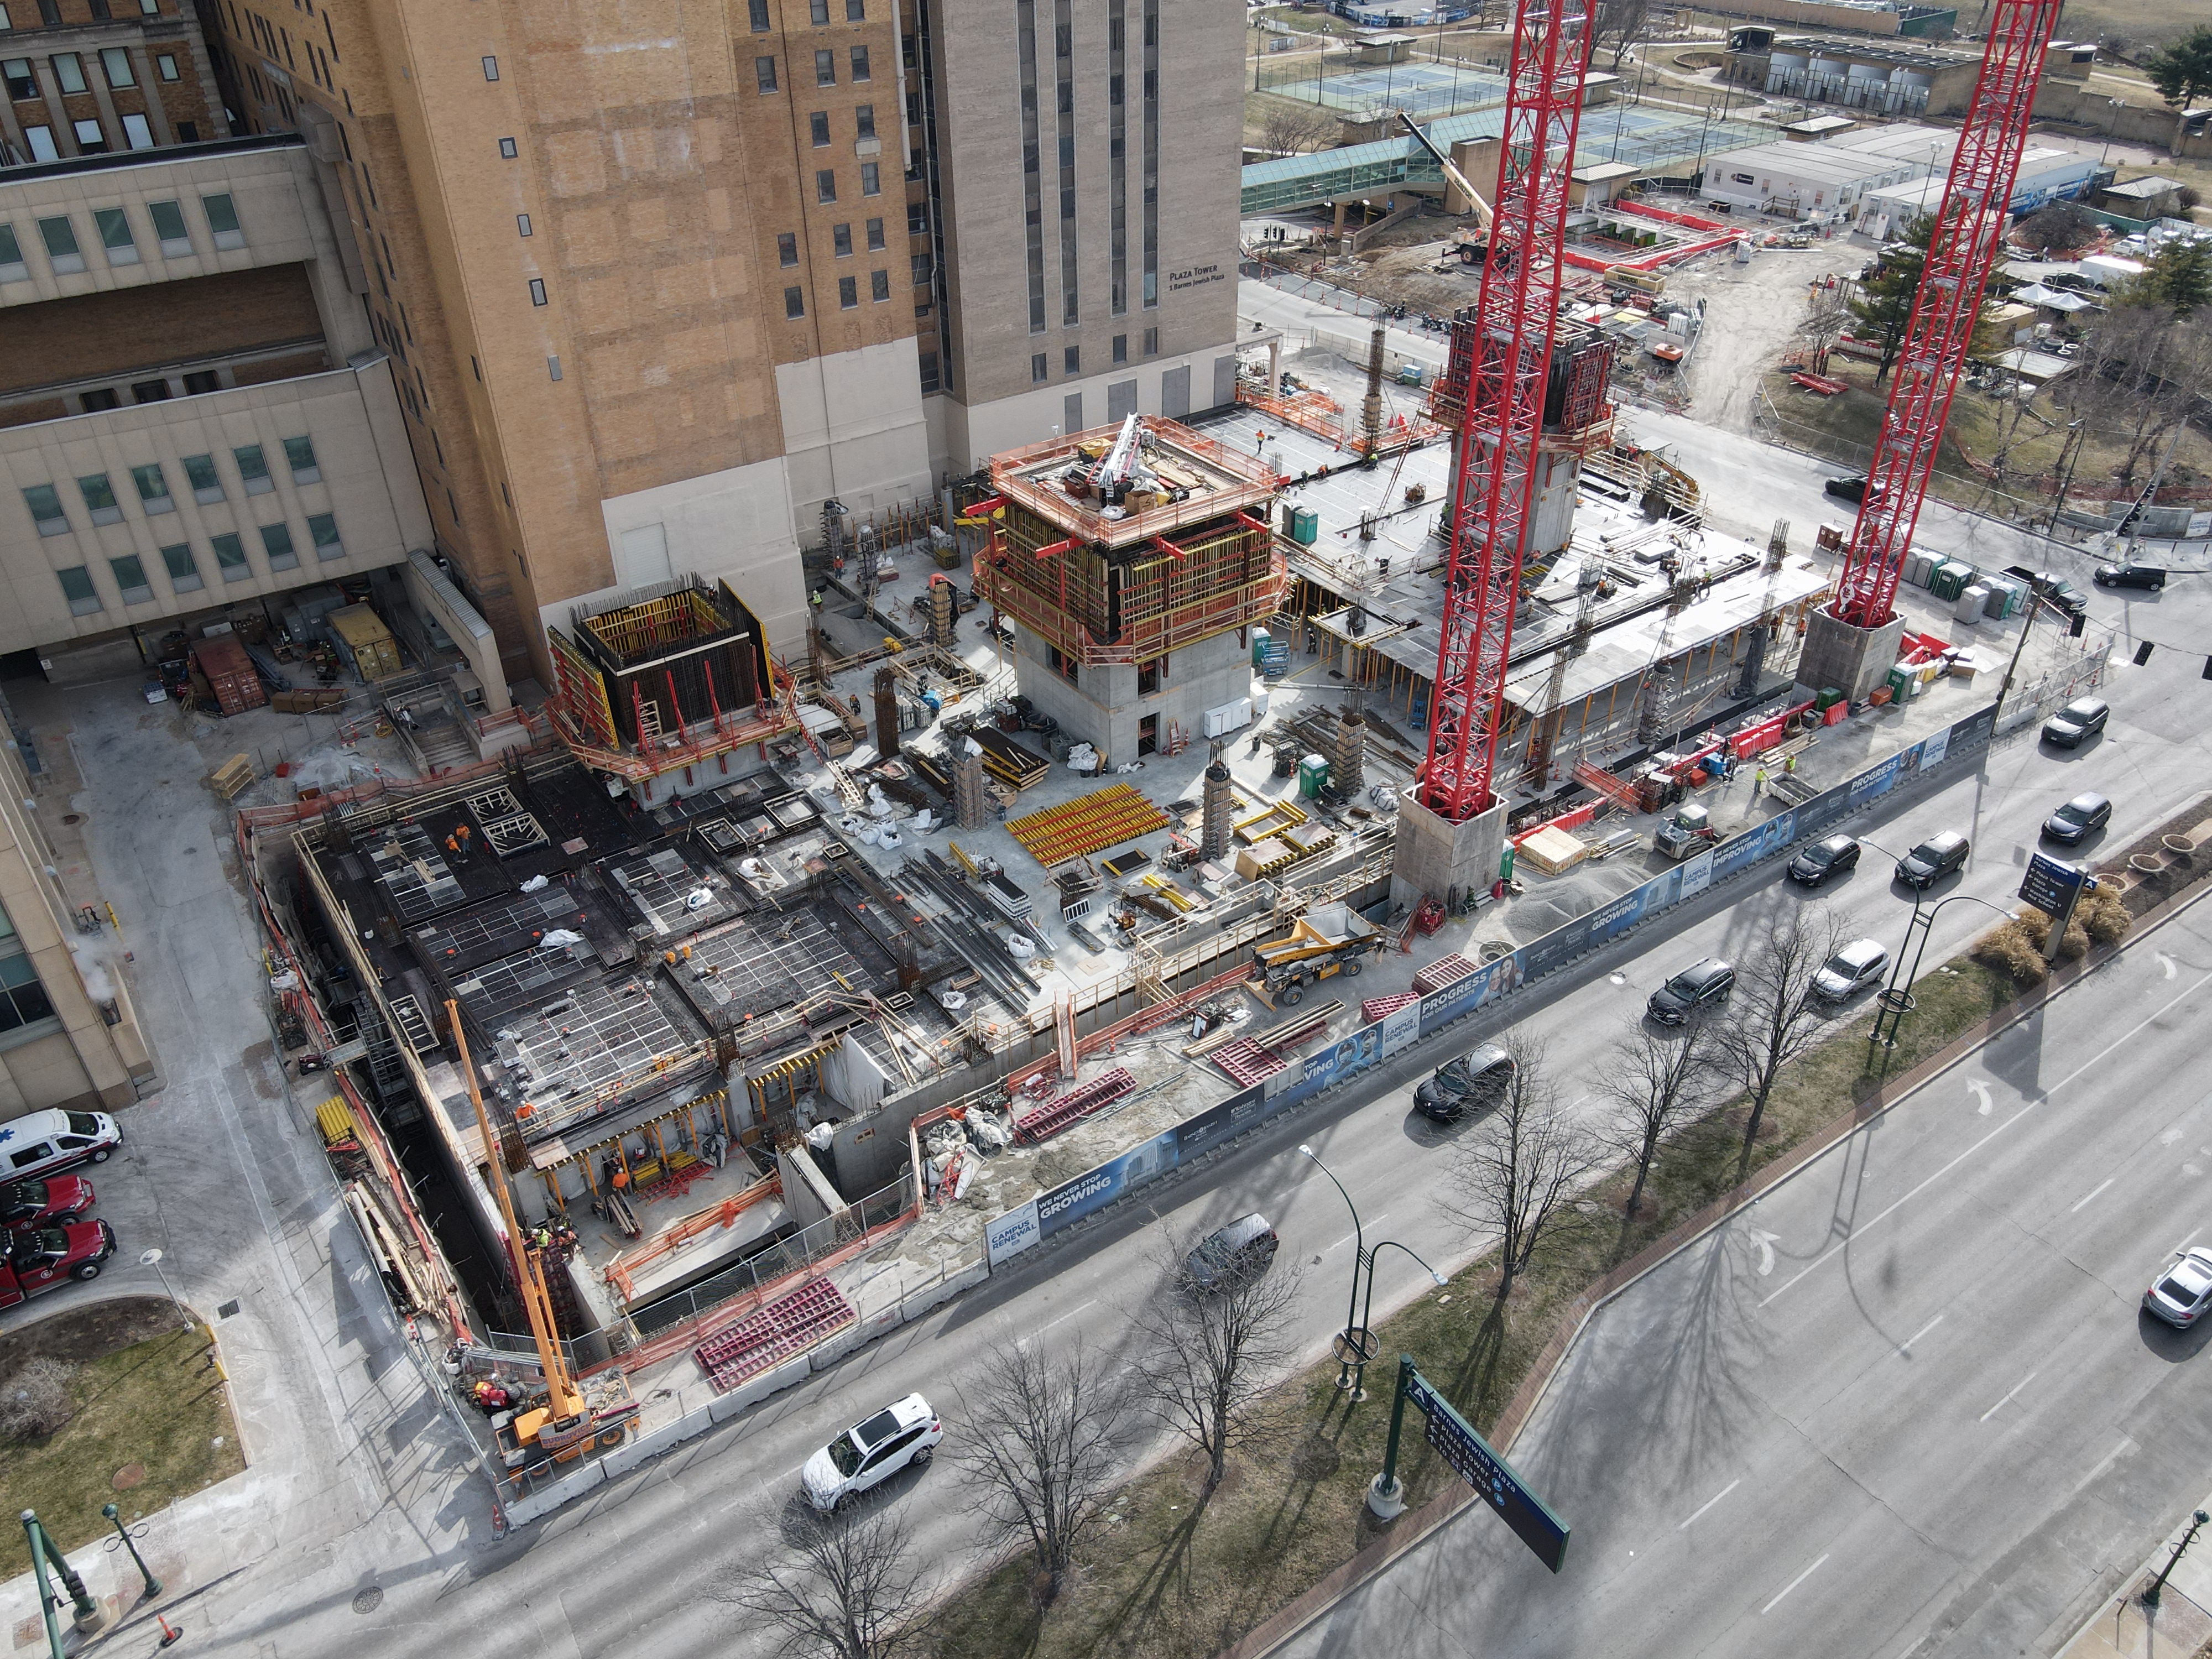
In the St. Louis area, LiDAR drone services can be valuable for land developers, civil engineering teams, construction managers, municipalities, industrial property operators, utilities, and organizations managing large or changing sites. A construction team may use LiDAR to better understand grading progress or site conditions. A developer may want more accurate terrain context before design work proceeds. Municipal or infrastructure projects may require efficient mapping of corridors, easements, drainage paths, or large public properties.
LiDAR can also support documentation over time. Repeated flights can help teams compare site conditions, track changes, and maintain a visual-spatial record of project evolution. This can be useful not only for operations and engineering but also for executive reporting, stakeholder presentations, and case-study development.
That crossover value is important. The most successful drone projects often serve more than one purpose. The data may support analysis, while the visuals support communication, marketing, or planning.
FLIR Thermal and LiDAR Are Strategic Business Assets
It is easy to think of FLIR thermal and LiDAR drones as niche technical tools, but that view is too limited. For many businesses, these services are strategic assets because they combine operational value with communication value.

A thermal roof survey can support maintenance planning while also providing compelling visuals for insurance discussions, internal reporting, or capital improvement presentations. A LiDAR-supported site documentation project can help engineers and planners while also supplying visual material for project promotion, investor presentations, public communication, or marketing content.
This matters because modern organizations increasingly need content that is informative, credible, and visually persuasive. Technical drone services can help bridge the gap between raw analysis and polished storytelling. When handled by an experienced production team, the resulting deliverables can support multiple departments at once, from operations and engineering to sales and marketing.
Why Experience Matters in Advanced Drone Services
FLIR thermal and LiDAR drone work are not commodity services. They require more than pilot skill. They require planning, site awareness, technical understanding, equipment knowledge, safety discipline, and a clear understanding of how the final deliverables will be used. Thermal imaging can be affected by time of day, weather, reflections, surface materials, and ambient conditions. LiDAR capture requires careful mission planning, data handling, and an understanding of the intended output.
Just as important, clients often need more than raw files. They may need edited visuals, still images, annotation-ready frames, presentation graphics, processed media, or integrated production assets that can be used across multiple platforms. A provider who understands both the technical capture and the communication side of the project can deliver much more value than one who simply flies and hands off data.

For decision makers, that means the right drone partner should understand not only the technology, but also the business purpose behind the flight.
Combining Technical Capture with Professional Media Production
One of the major advantages of working with a full-service production company for FLIR thermal and LiDAR drone projects is the ability to transform specialized capture into usable business media. Many organizations do not just need inspection imagery or mapping visuals. They need deliverables that work in presentations, websites, proposals, project updates, sales materials, training pieces, recruiting campaigns, and stakeholder communications.
That requires more than technical acquisition. It requires editing, post-production, visual consistency, formatting flexibility, and an understanding of how to shape technical material into clear communication. When drone services are backed by an experienced photography and video production team, the results are more versatile and more valuable.
A single project can often yield technical documentation, branded visuals, aerial stills, edited case-study videos, presentation support graphics, and content for multiple communication channels. That type of repurposing is exactly where organizations can gain more traction from one well-planned production effort.
The Future of Drone Services in St. Louis
As businesses continue to seek faster assessments, clearer documentation, safer data collection methods, and better visual content, the role of drones in commercial production will only grow. In St. Louis, where businesses operate across construction, manufacturing, healthcare, logistics, infrastructure, education, utilities, real estate, and corporate services, FLIR thermal and LiDAR drones offer practical solutions for both technical and communication needs.
The organizations that benefit most are often the ones that think beyond the flight itself. They view drone services not just as an aerial add-on, but as part of a broader strategy for better information, better media, and better decision-making.
Experienced FLIR Thermal and LiDAR Drone Services from St Louis Drones
At St Louis Drones, we understand that advanced drone work must do more than capture images from above. It must produce useful, professional results that help businesses and organizations solve problems, communicate clearly, and present their capabilities with confidence. As an experienced full-service professional commercial photography and video production company, St Louis Drones has the right equipment and creative crew service experience for successful image acquisition.
We offer full-service studio and location video and photography, as well as editing, post-production, and licensed drone services. St Louis Drones can customize your productions for diverse types of media requirements. Repurposing your photography and video branding to gain more traction is another specialty. We are well-versed in all file types and styles of media and accompanying software. We use the latest in Artificial Intelligence for all our media services.
Our private studio lighting and visual setup is perfect for small productions and interview scenes, and our studio is large enough to incorporate props to round out your set. We support every aspect of your production, from setting up a private, custom interview studio to supplying professional sound and camera operators, as well as providing the right equipment, ensuring your next video production is seamless and successful. We can fly our specialized drones indoors. As a full-service video and photography production corporation, since 1982, St Louis Drones has worked with many businesses, marketing firms, and creative agencies in the St. Louis area for their marketing photography and video.
For organizations exploring drones for FLIR thermal and LiDAR in St. Louis, experience, production quality, and strategic thinking all matter. St Louis Drones brings those strengths together to help clients capture more than footage. We help them capture meaningful information and turn it into media that works.
Rob Haller 314-604-6544 stlouisdrones@gmail.com